Solution
Data Visualisation R&D
Question how your users experience and interact with information. We work with big data and ML to design, prototype and deliver new ways of seeing data.
At Variable data is at the core of our design process. Though workshops, research & exploration, prototyping, production and testing we offer range of capabilities helping companies get the most of their data.
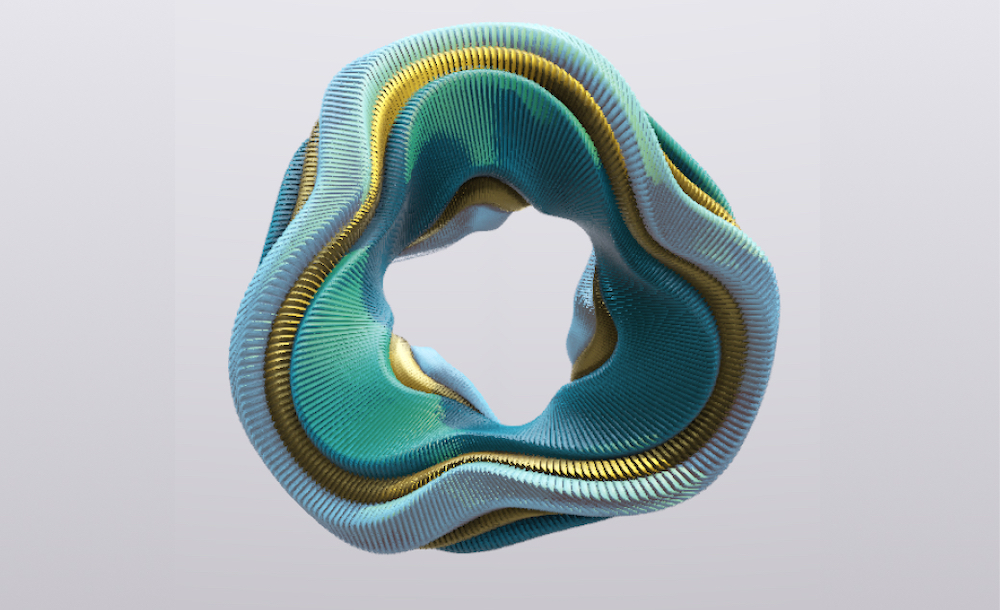
We believe data is not a number and as such it should be explored and interacted with a living organism, a sculpture, a space to dive into.
Trusted by
“Data visualisation as an exploration of possibility space”
- Explore Big Data
- See patterns from a different point of view
- Visit data worlds, not just maps
- And more...
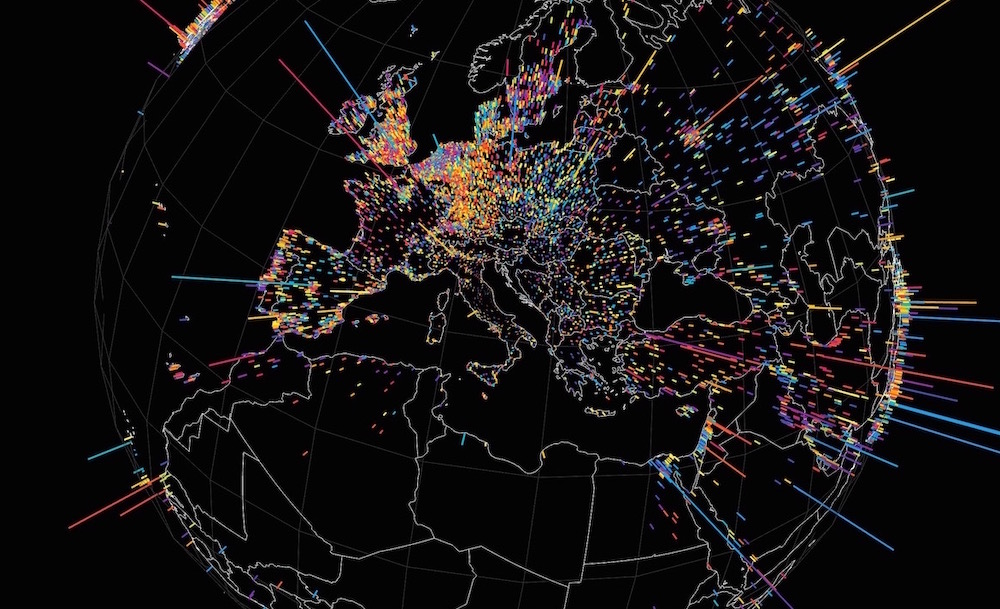
Explore Big Data
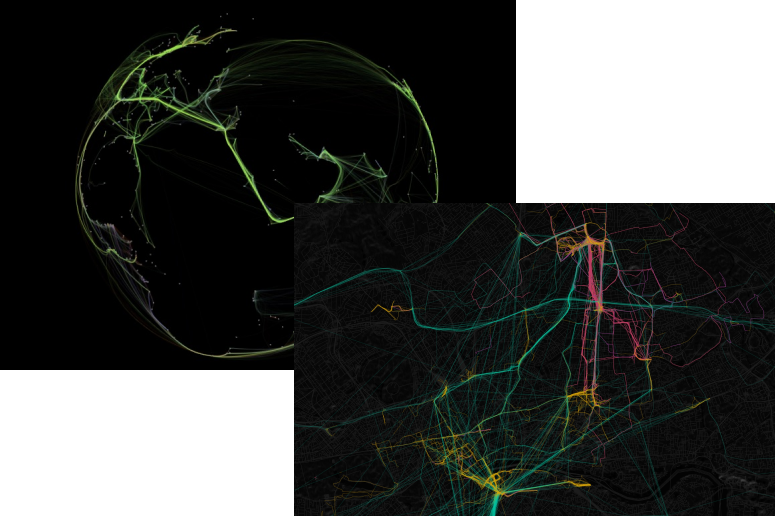
See all your data. Connect to wide range of data sources like data bases and realtime APIs and bring them to life. Using PEX - our in-house 3d WebGL engine - we can visualise millions of data points and deliver complex yet stunning graphics for desktop or web.
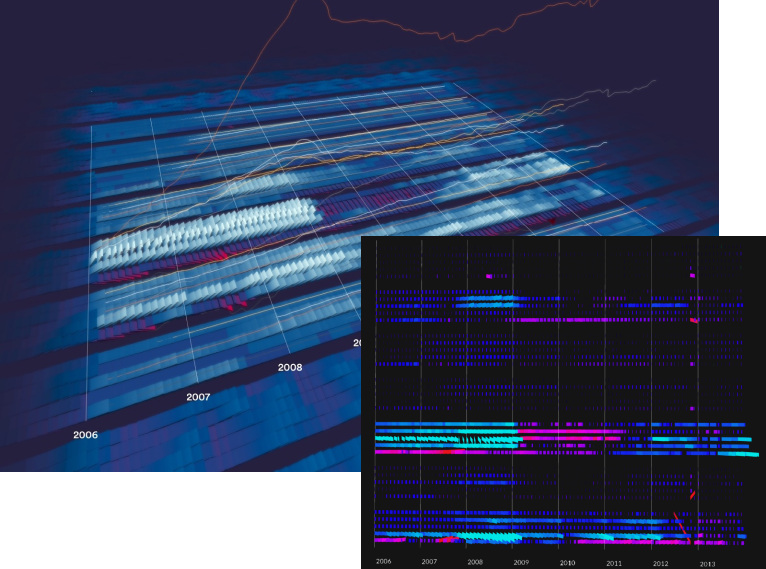
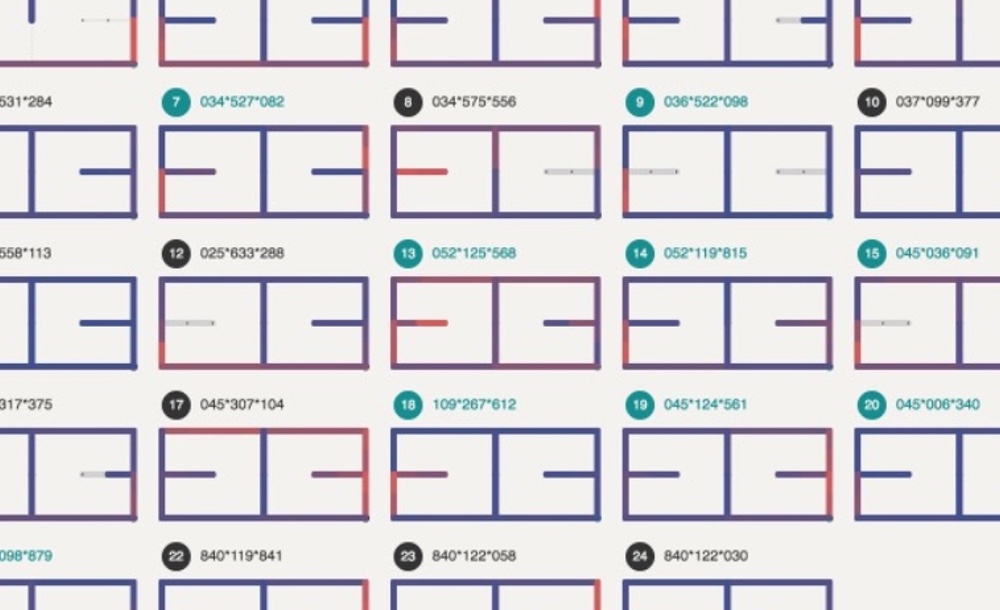
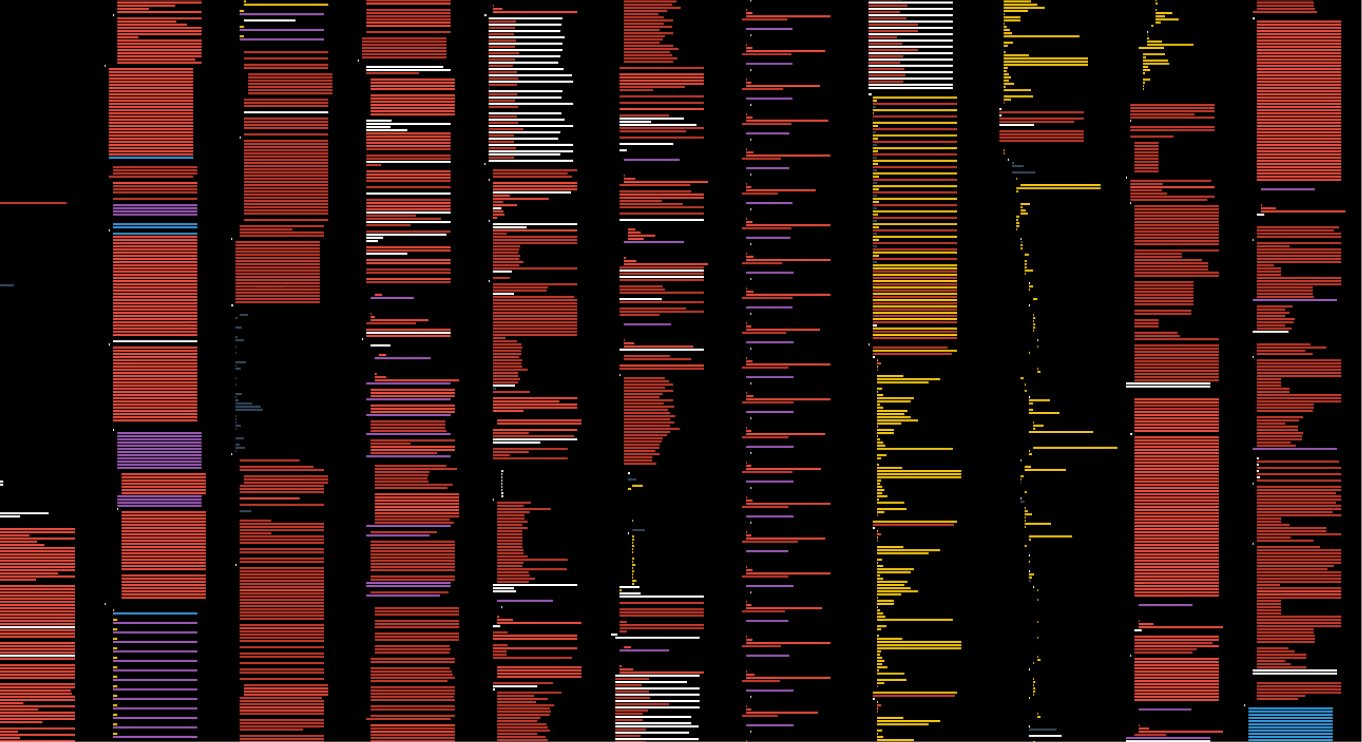
See patters from a different point of view
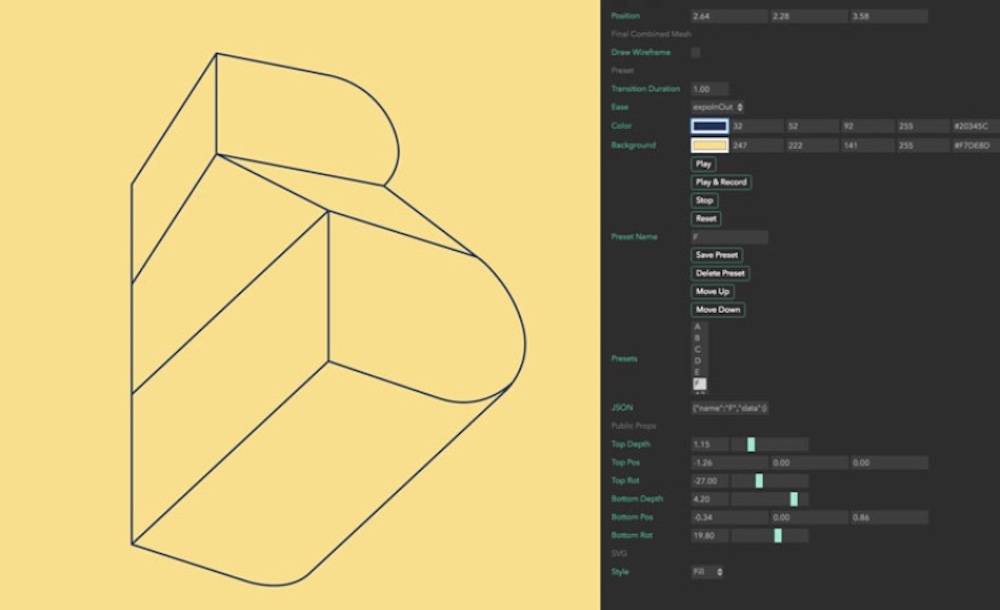
Not sure about best approach to visualise your data? Nodes - our visual data exploration tool allows for great flexibility of outputs while reusing the data processing pipeline once in place. Scale up from data static graphs, to interactive tools to 3d data environments.
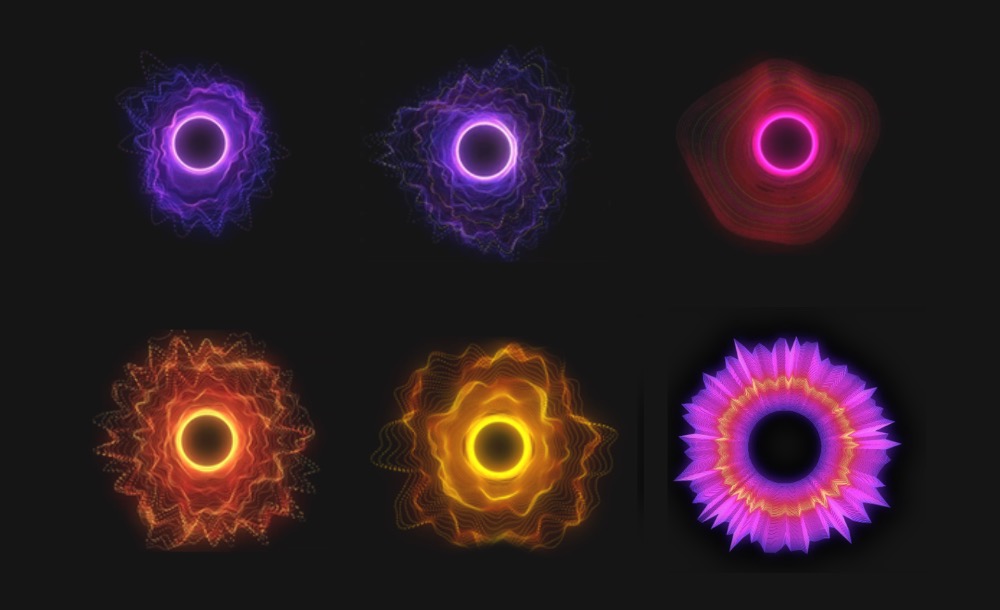
Say bye to cookie cutter solutions
Through our research and prototyping cycle we can arrive at unique solutions, fast. Surprise your clients with visualisations they have never seen before without sacrificing readability and accuracy.
Visit data worlds, not just maps
We think of data as a place you can visit. Through immersive installations, interactive websites and VR environments we enable you to experience the true shape of data first hand.