Platts
Threads
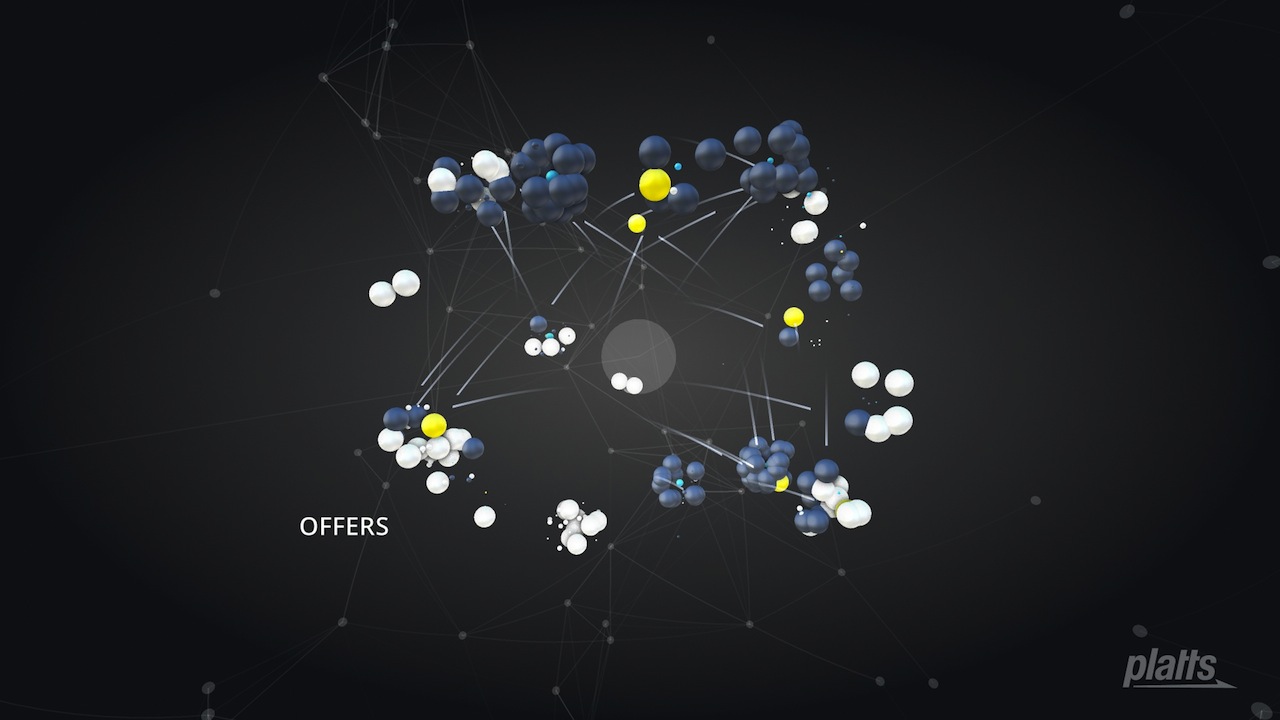
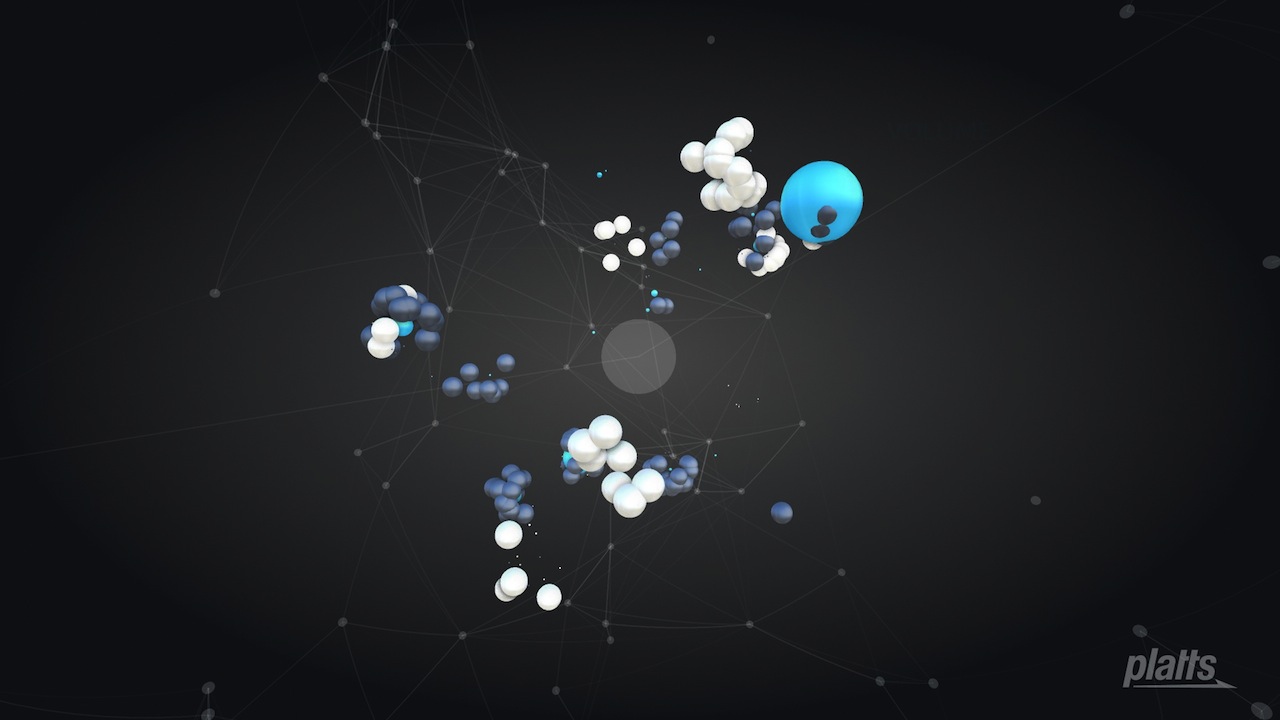
Threads is a visualization of constantly changing bids and offers on asian fuel markets.
For the launch of new P4D software by Platts, Variable was invited to visualize market data as never seen before.
Client
- Platts
2013 / London, UK

Data
In order to produce the animation Variable analized 1 year worth of data from 2012 provided by Platts. By looking at trends and behaviours the best visualization was chosen.


Process
We started by displaying all the transactions in the 3d space and clustering them by buyer and seller.


Below you can see first render off the transactions taking place during a week of data.