Self Commissioned
You Are I/O
A series of artworks on metadata and algorithmic identities.
You Are I/O is an attempt to understand how our actions online being constantly tracked, measured and quantified allow machines to build our ever evolving digital identity.
Client
- Self Commissioned
2017
When visiting a website nowadays we no longer communicate with only one server but a whole network of interconnected ad networks, content servers and 3rd party social plugins. Looking at 6 months of ones browsing history and how those 96k visited websites and 2.9 million server requests can be categorised we start asking questions:
Am I Polish, English, Danish, Korean or American?
A parent, company owner, developer or an artist?
Male / father or female / mother?
Who are we?
“Our datafied lives, when aggregated and transcoded into quotation-marked categories, increasingly define who we are and who we can be.”
“As subjects to algorithmic interpretation, who we are also changes “from point to point,” moving from ‘woman’ to ‘man’ or ‘old’ to ‘young.’”- John Cheney-Lippold
_

If you look at my lunch and leisure time browsing and compare that with publicly available data you might see completely average polish immigrant living in London.
Male 25-35. Frantically refreshing The Guardian and BBC websites scavenging for newest information about Brexit.
During the day though I’m more “real” me. A 30+ coder, company owner. Perhaps 75% polish or 10% danish as I lived in Denmark for 5 years before and still have many friends on Facebook there.
My geolocation data is confusing though. I live in UK, do most of my projects for US clients, I use ‘z’ insted of ’s’ when I spell “data visualization” (which drops me to the second page of Google results btw).
Maybe I’m 40% American then?
Some website seem to disagree.Where would all those ads of prams, nursing bras, baby photographers?
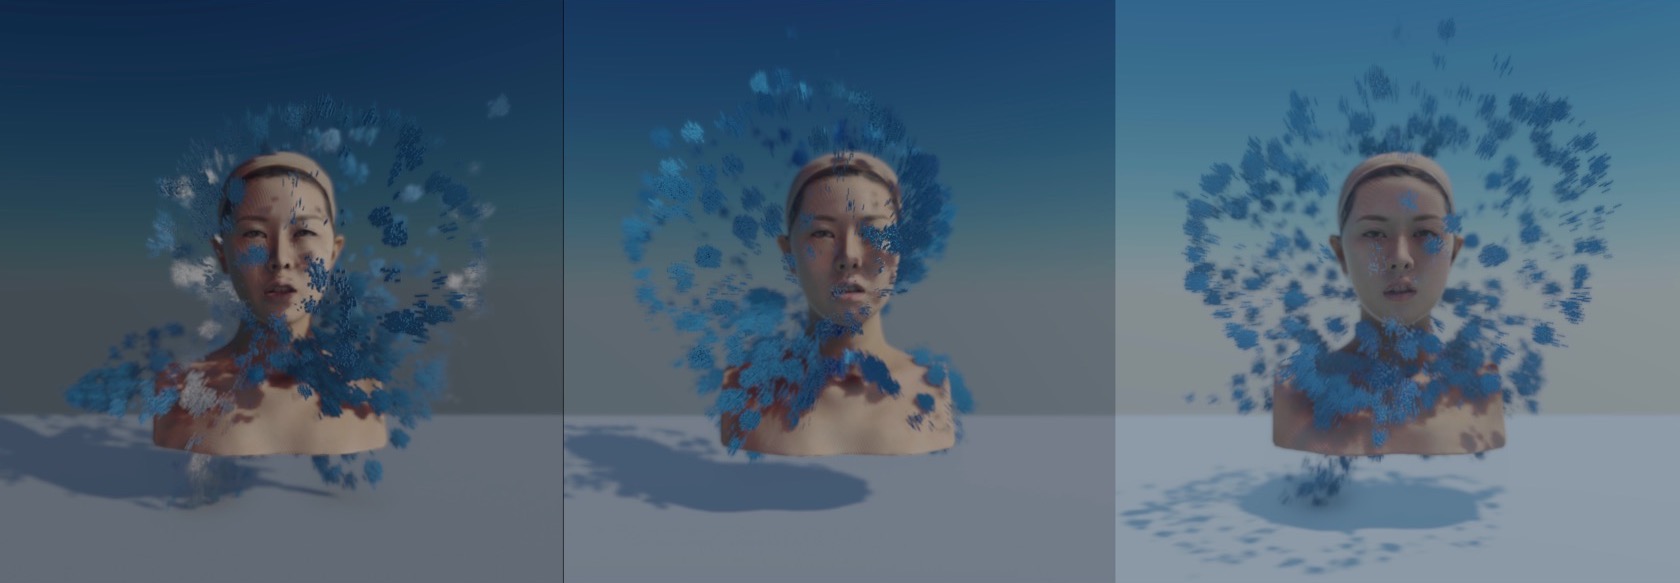
Maybe I'm 50% korean woman then?
Surrounded by data


Metadata
To understand we first need to see.
Using bespoke visualisation tool 96k websites has been analised. Different colors represent different types of content transfered: scripts, images, video, text and data.


