Website
After almost a year of work we finally relaunched our website with new a identity, a unified color scheme, new typography, beautiful project pages and a mobile layout. Our studio page includes more info on what we are trying to achieve and the team profiles.
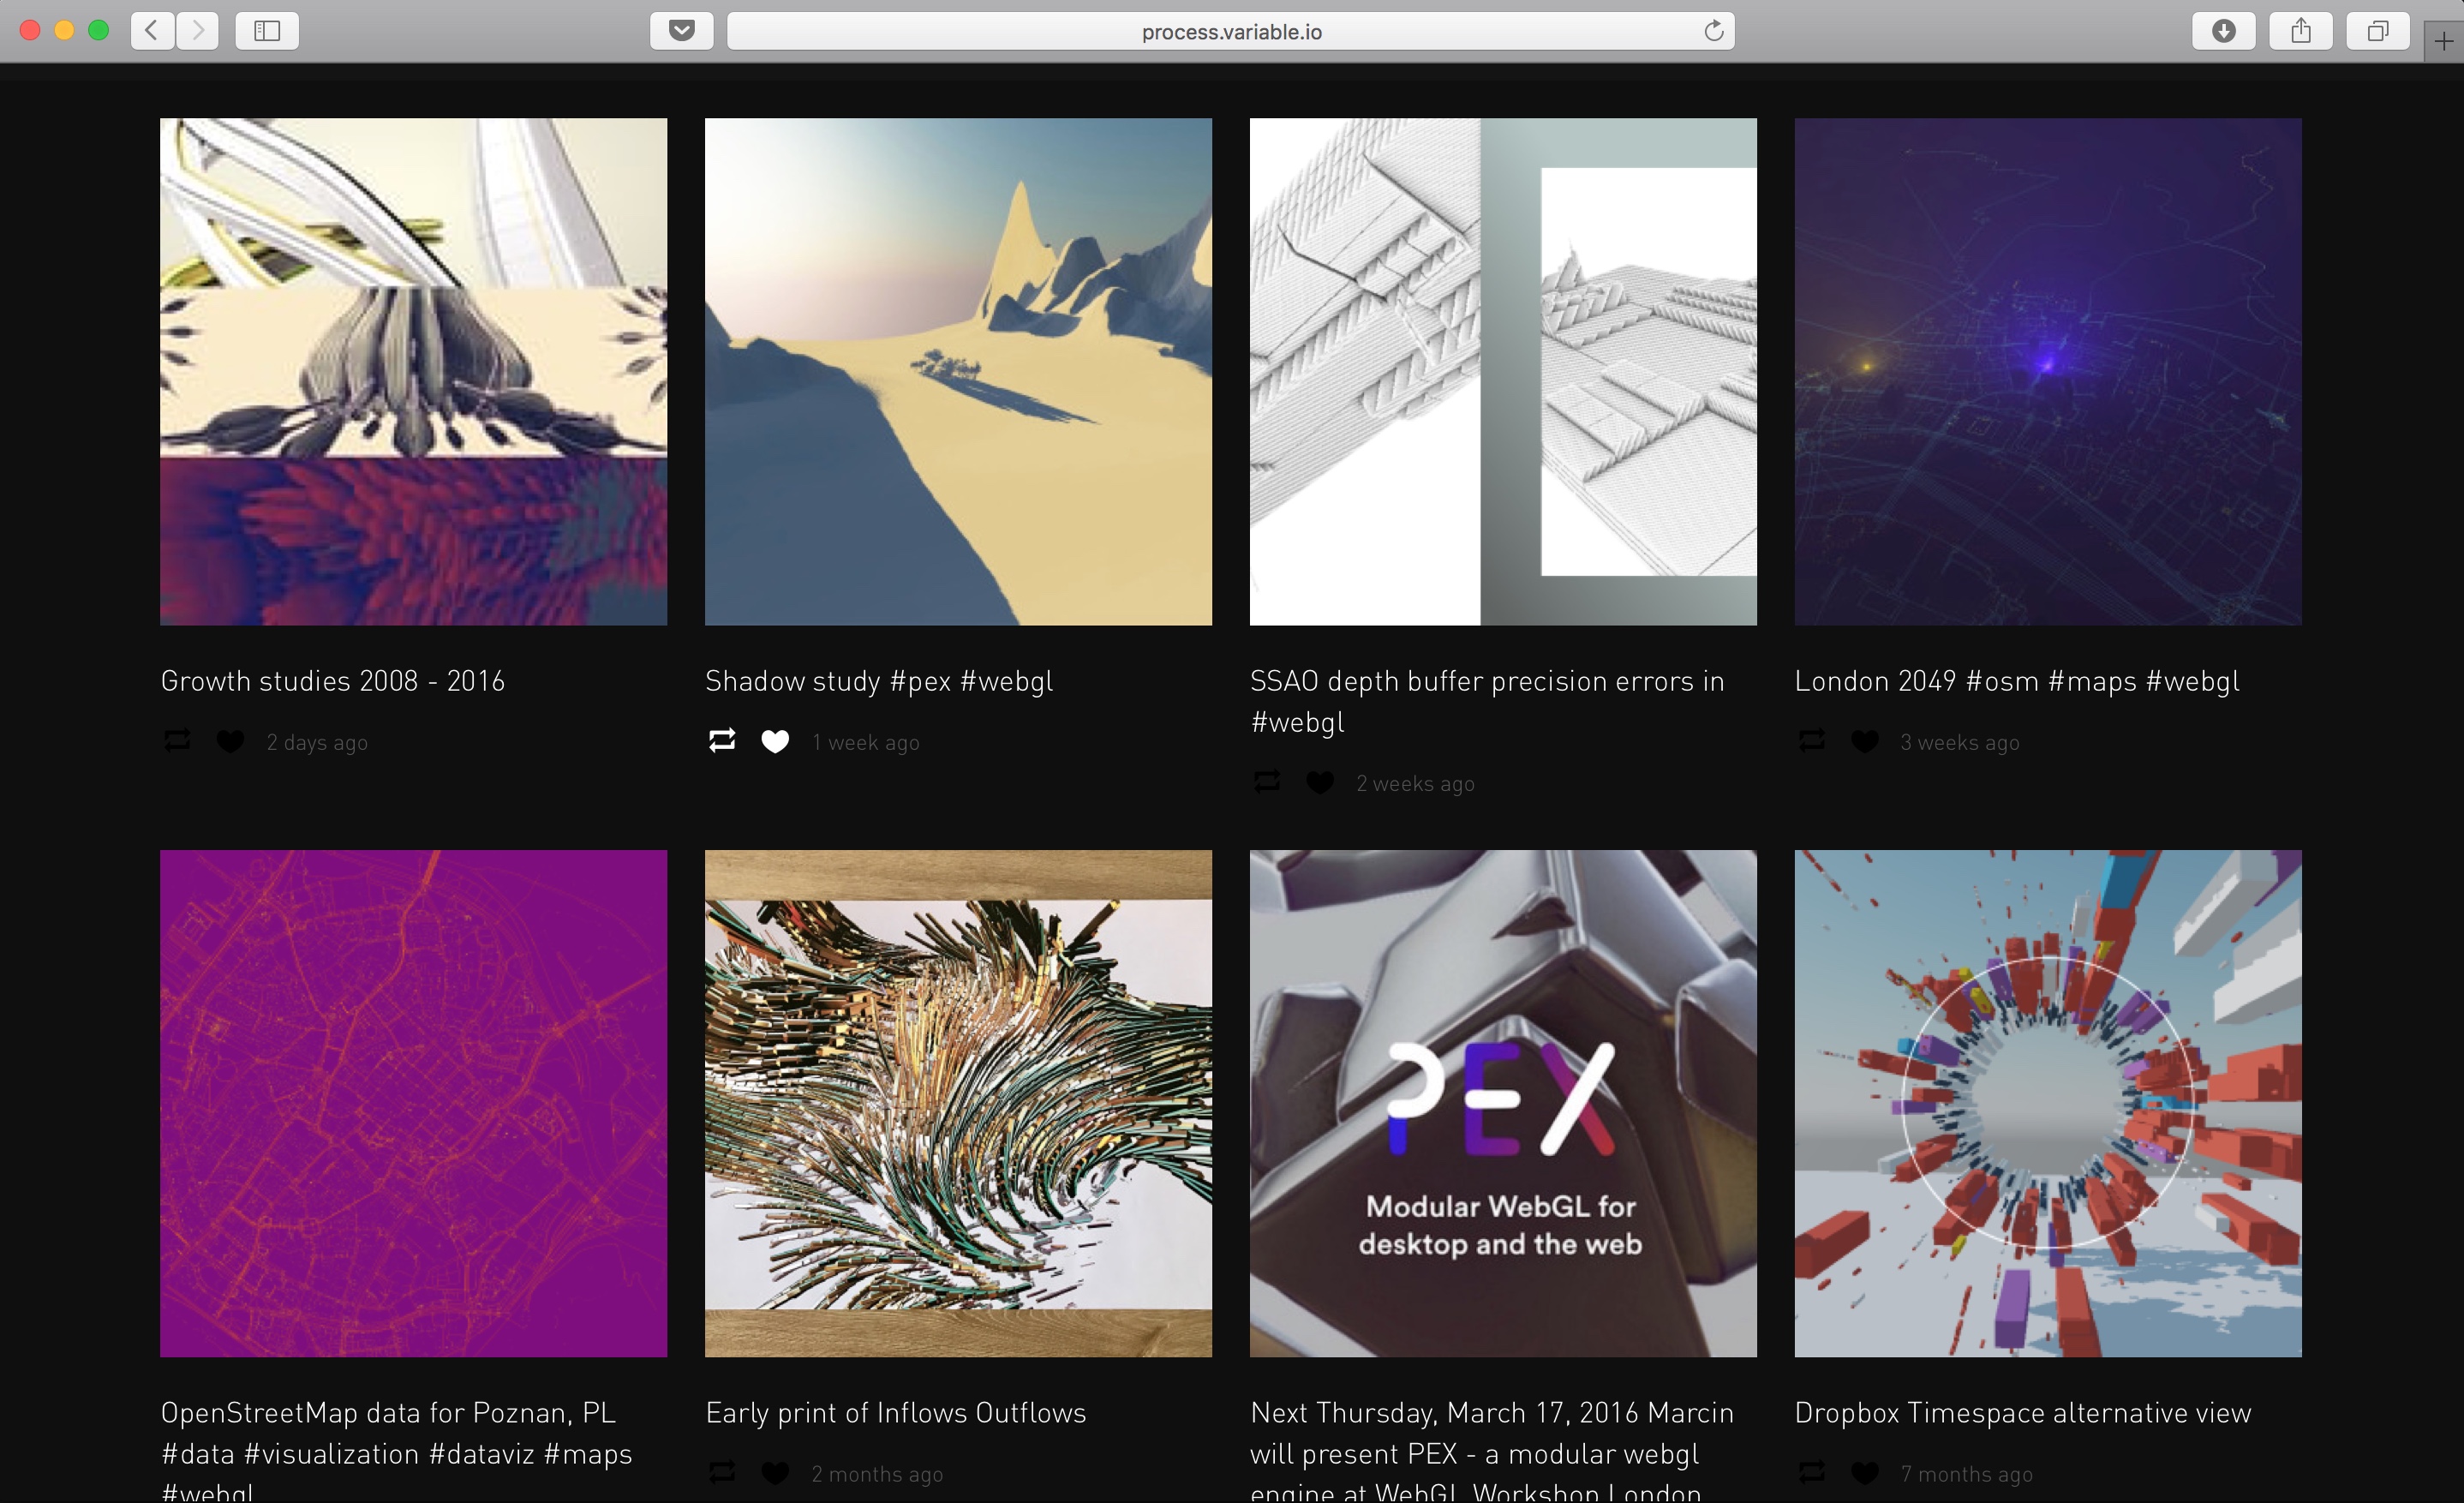
Another welcome addition is the http://process.variable.io tumblr.
Team
In May 2016 Nick Nikolov joined Variable as the first full-time employee. We have always had collaborators and interns at but having Nick on the team every day means better projects, more R&D and lots of good music.

Projects
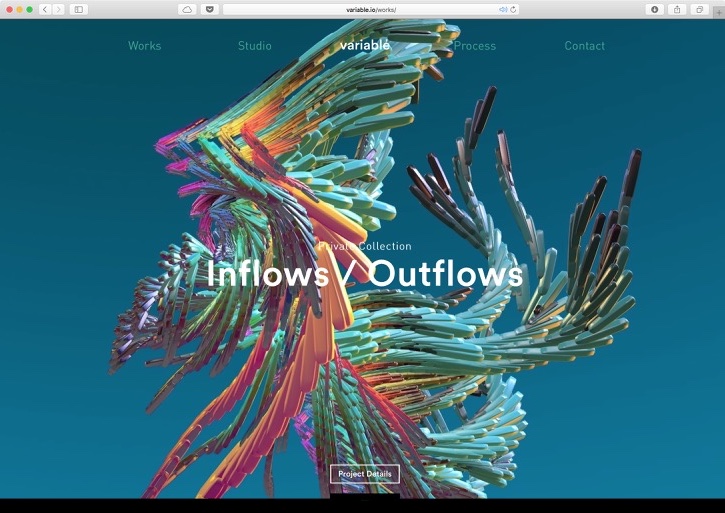
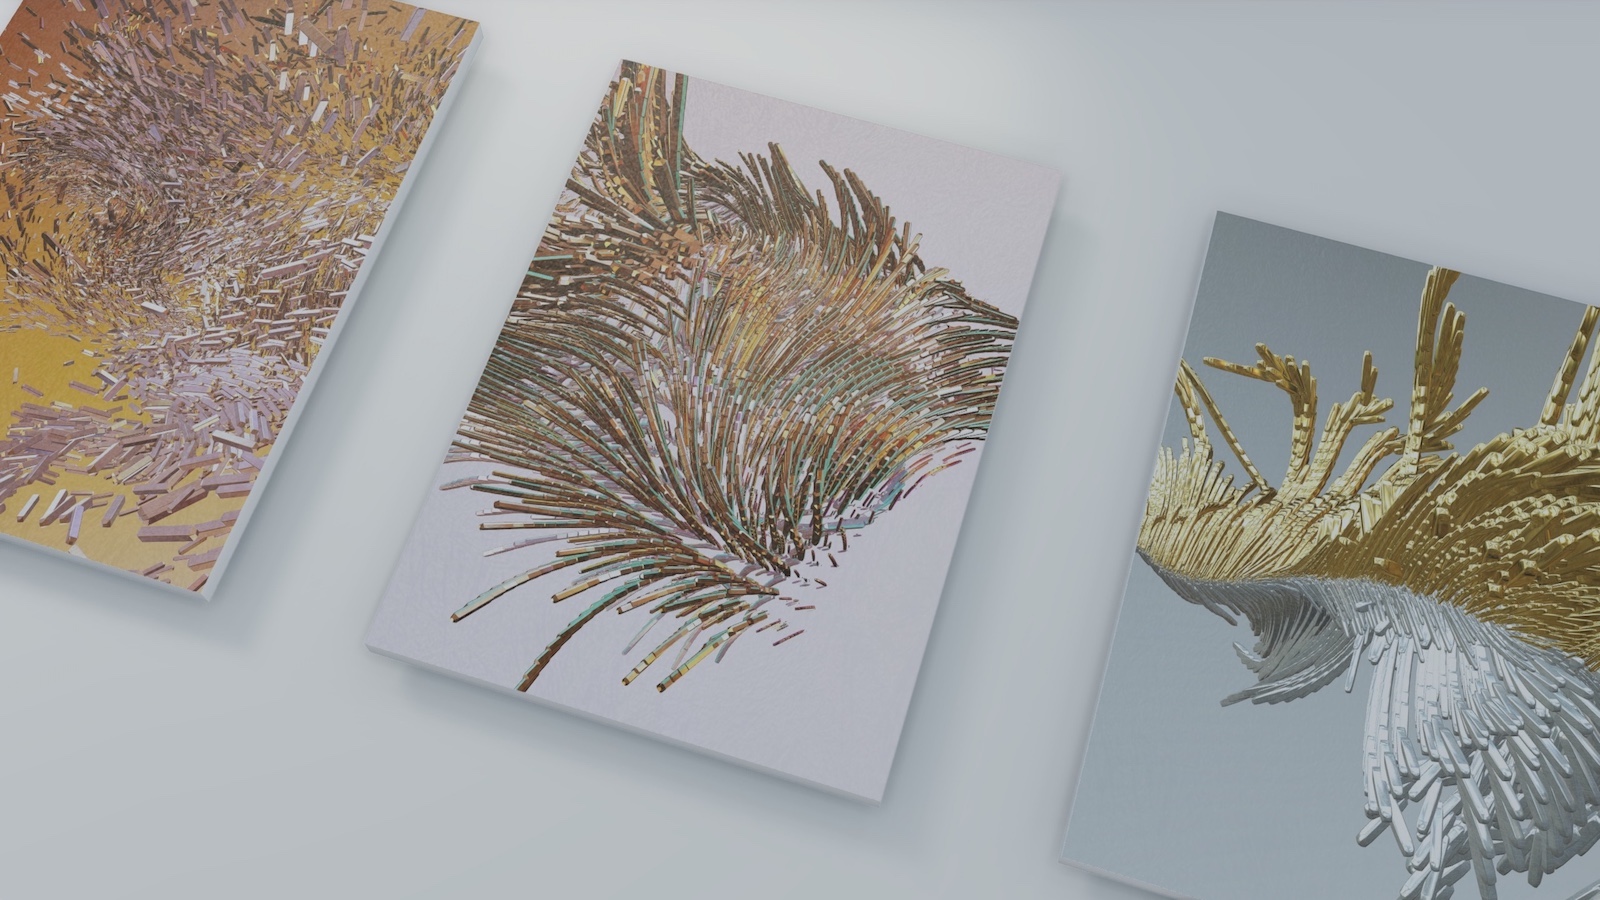
Inflows-Outflows is a series of 4 data-driven artworks reinterpreting population flow data. Created in WebGL, based on 10 million data points and printed in gorgeous A0 format. Although the project is from 2015, we kept delaying announcing it until our new website was ready. I still think it was worth the wait.
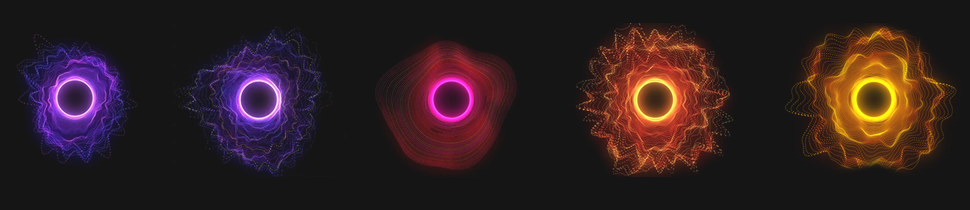
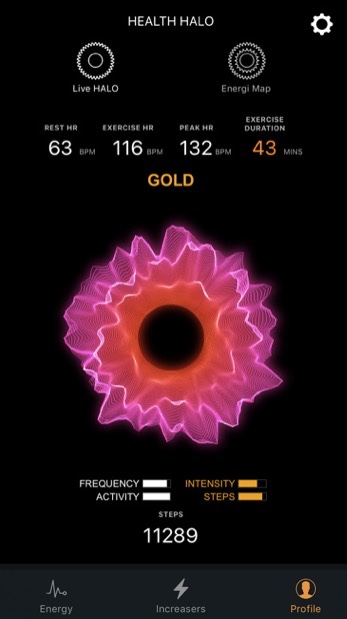
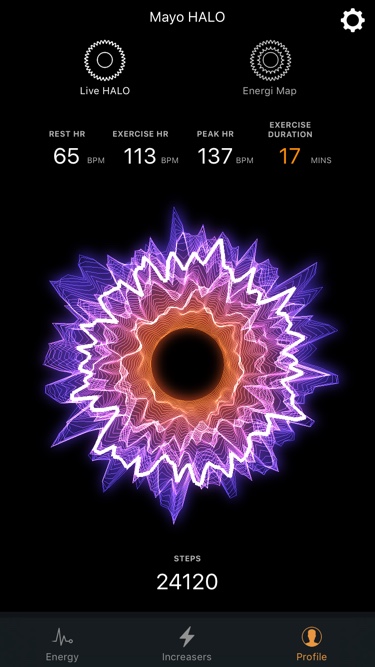
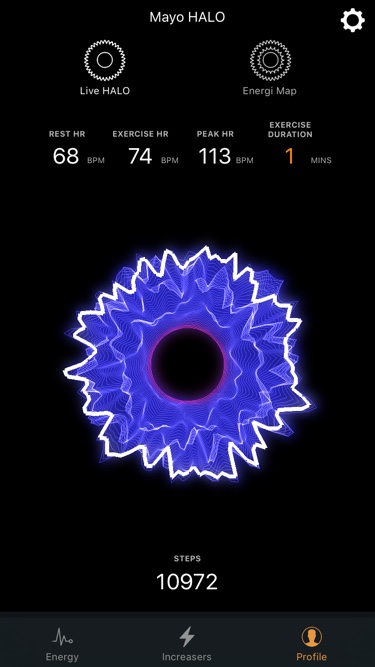
Halo - Since 2014 we work with Ora on Halo - a data-driven avatar that can morph and respond to your fitness activity and monitor your heart rate. Depending on your performance the shape and color of Halo changes giving you intuitive understanding of your health state. We recently hit beta in partnership with Mayo Clinic, one of the top US hospitals.
IMA LDN is an interactive web application showcasing all infrastructure projects happening in London up to 2050. It allows Greater London Authority and selected partners to exchange information about future developments in order to improve collaboration and planning. Infrastructure Mapping Application for London (IMA LDN) was a joint effort between Variable working on the data visualization and UI, Squint/Opera working on the UX, and Esri UK taking responsibility for the maps and GIS backend. You can see live version of the app at http://maps.london.gov.uk/ima/

Rat.Systems - The Rodent Activity Transmission systems project monitors a colony of naked molerats and produces two kind of outputs: a data visualization website, trying to explain the current state of the colony based on the tracking data and more artistic interpretation of the colony. Molerats are very unique mammals as they live in eusocial colonies with a queen and breeding males (like bees), they never get cancer and reach the age of 20+ years which is 5x more than mice or rats. We track a colony of 24+ molerats using RFID readers placed around a network of tunnels in a lab at the Queen Mary University. Rat.Systems is a collaboration between Variable, data artist Julie Freeman and a biologist Dr Chris Faulkes.


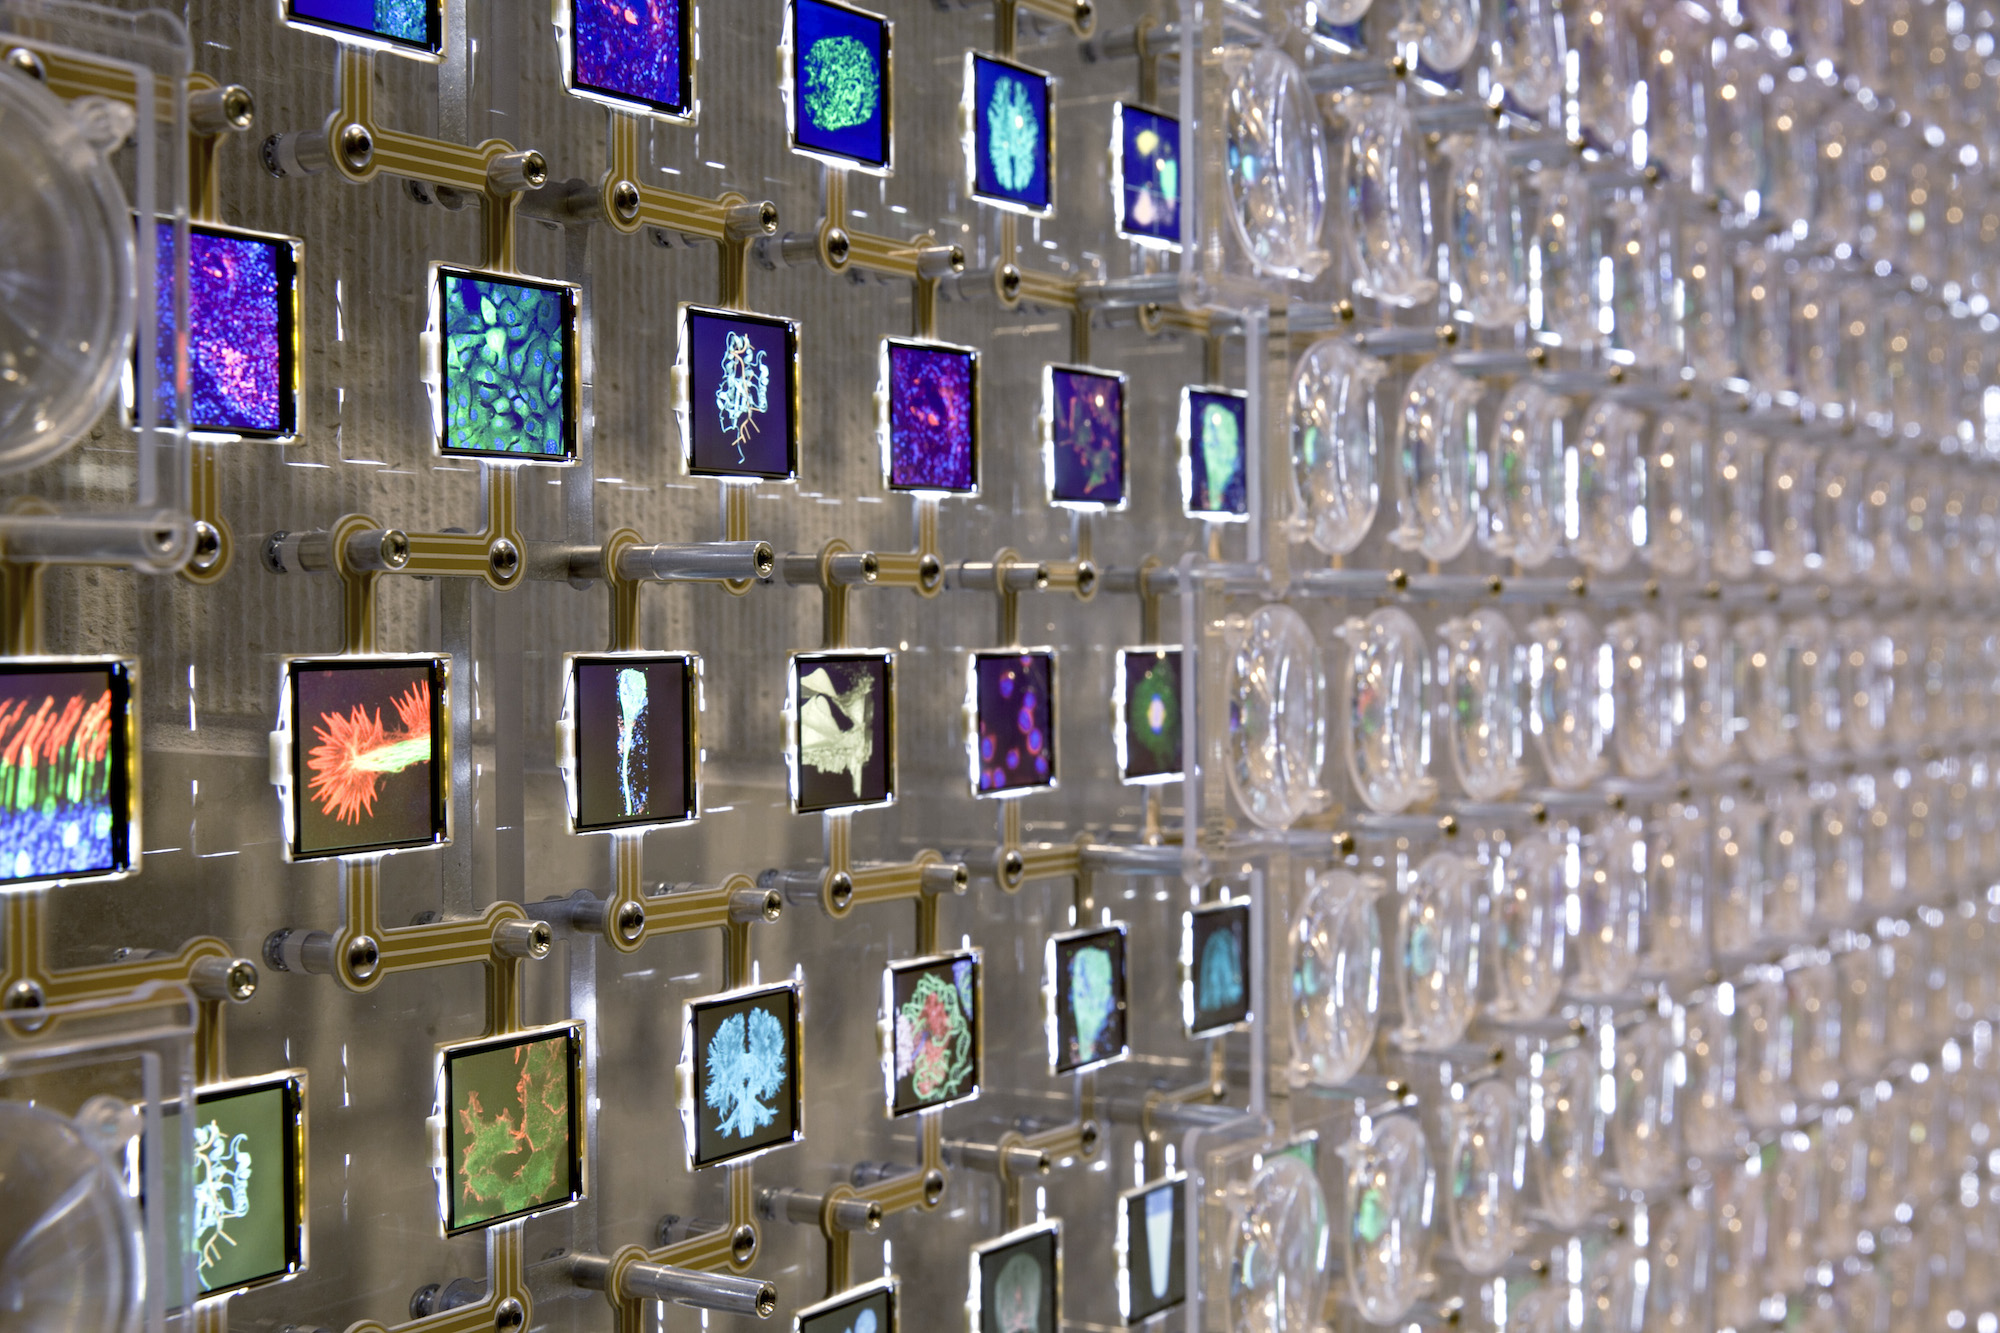
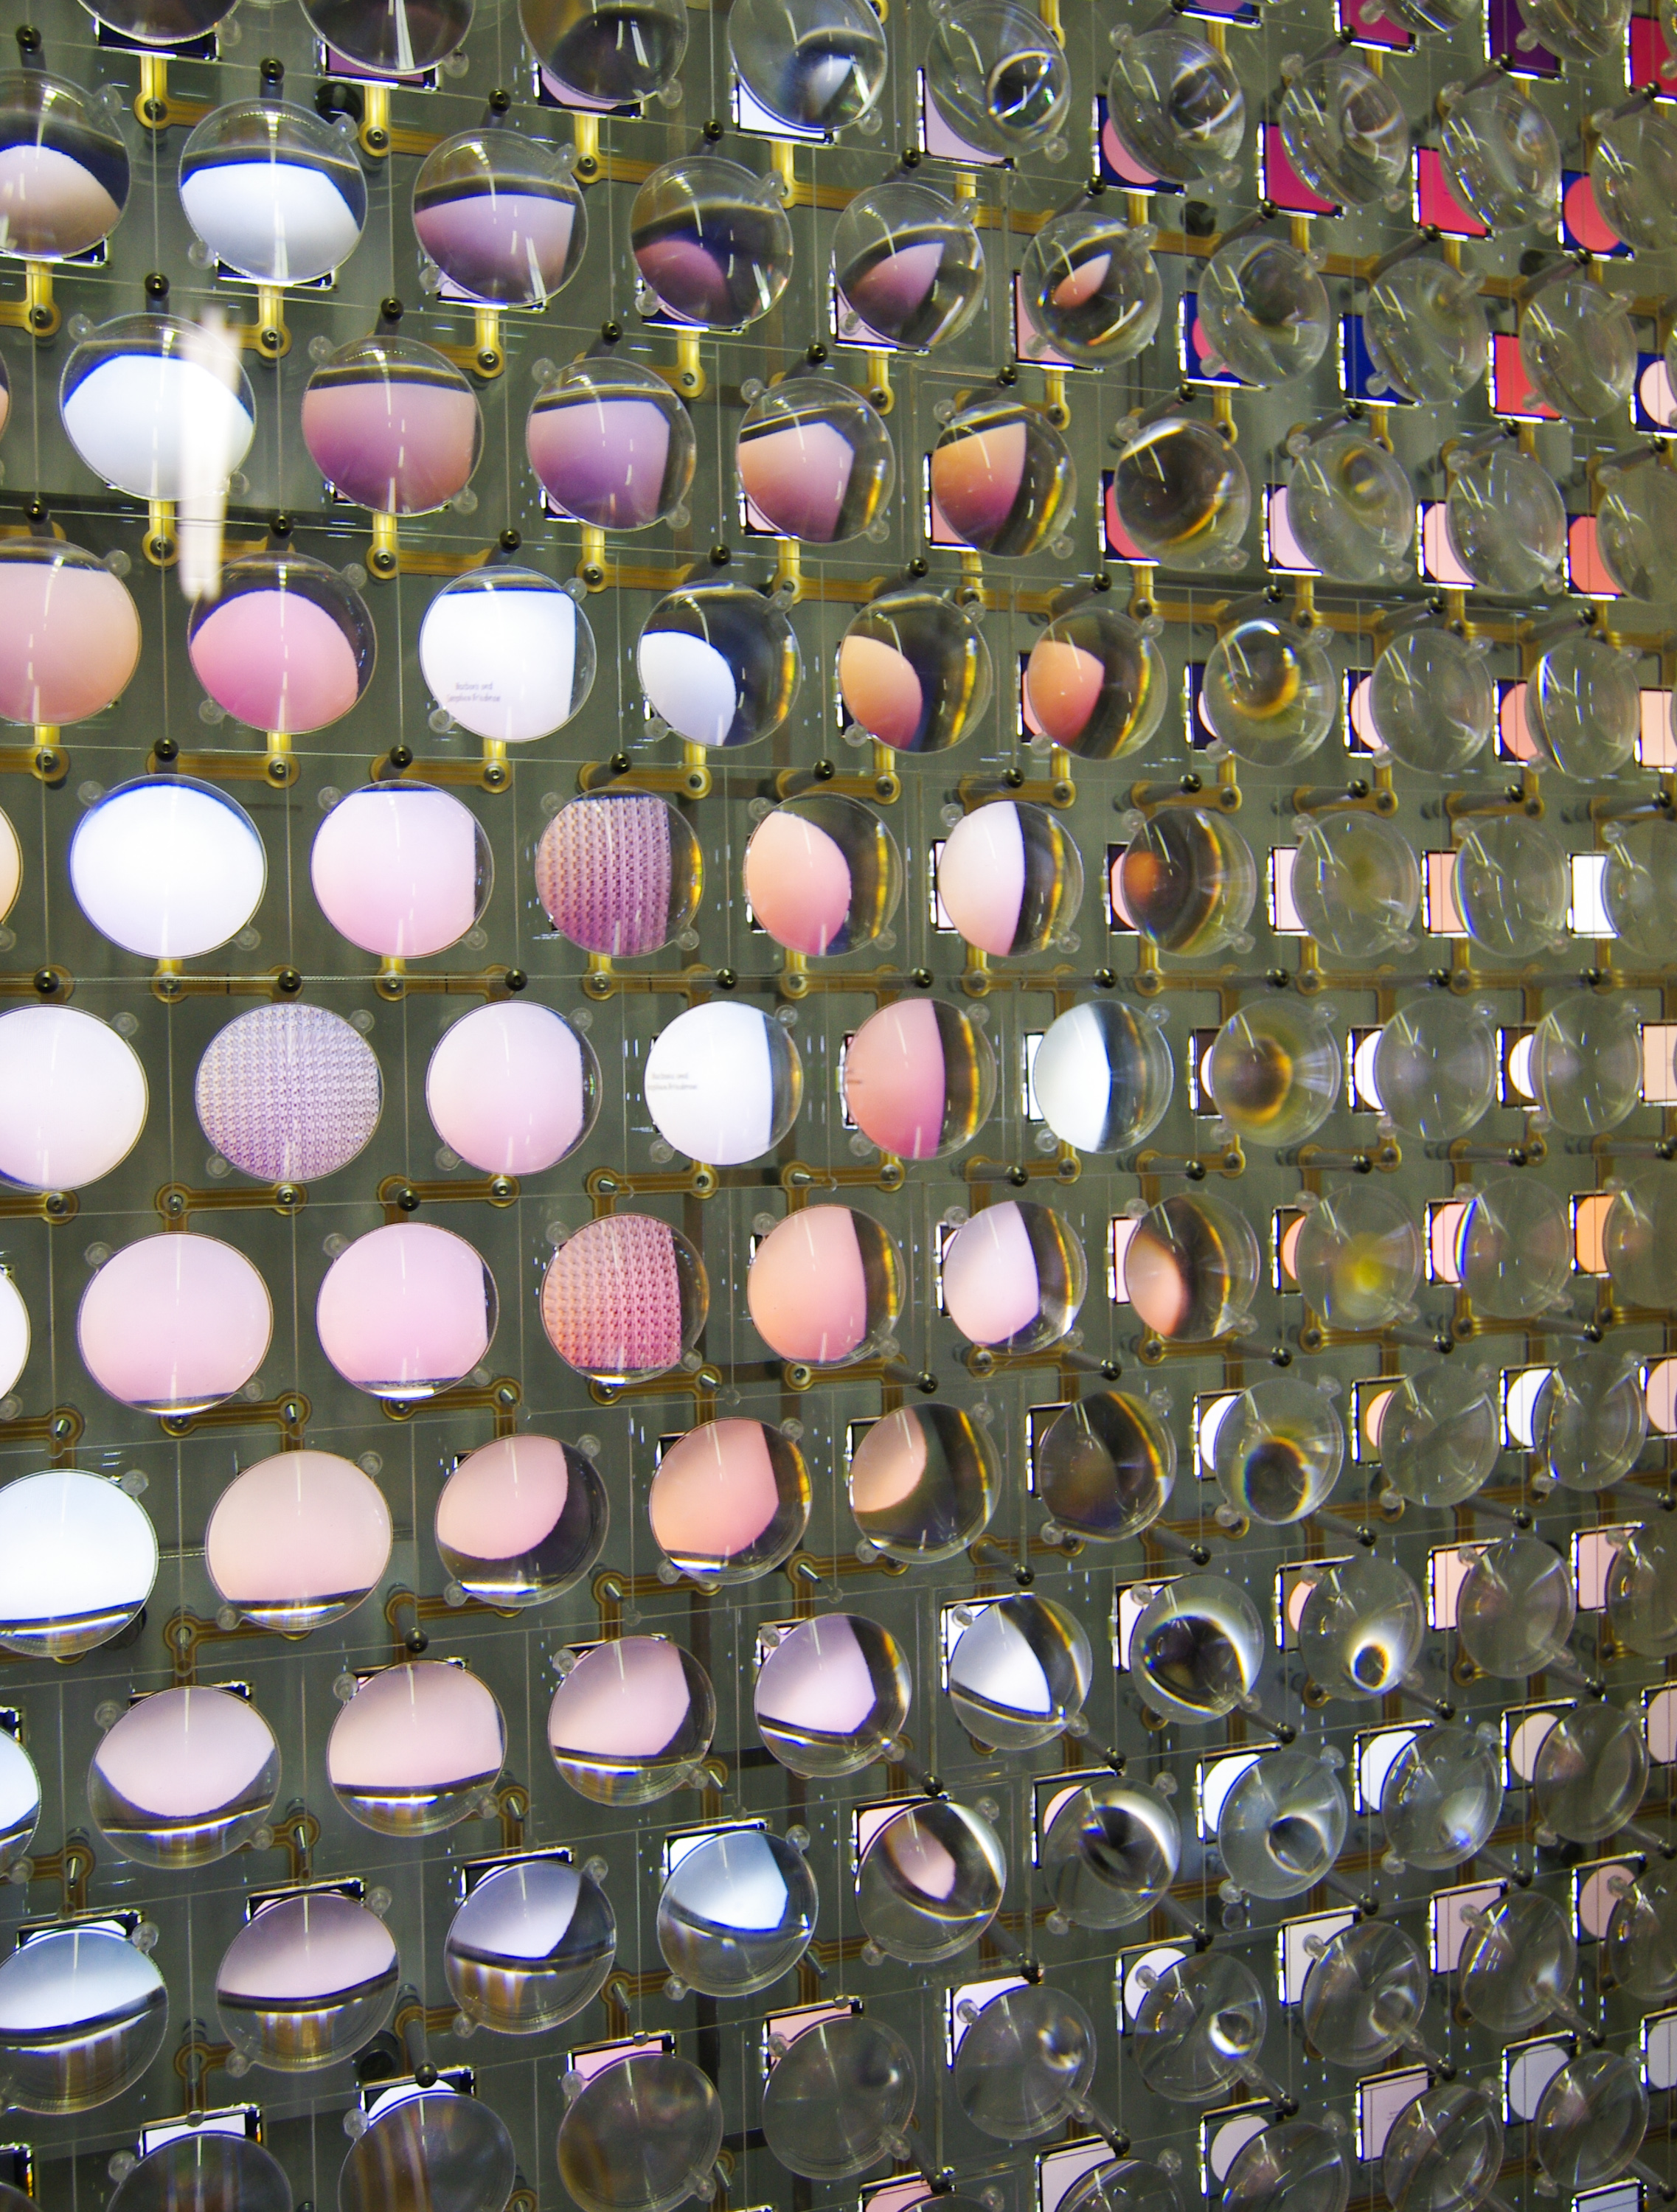
We also worked with National Science & Technology Medals Foundation and Local Projects, updated Discovery Wall for Weill Cornell Medical College with Hirsh & Mann and are part of Colour-in City, exploring how chat bots and data visualization can help with overcrowding in Lambeth Council.

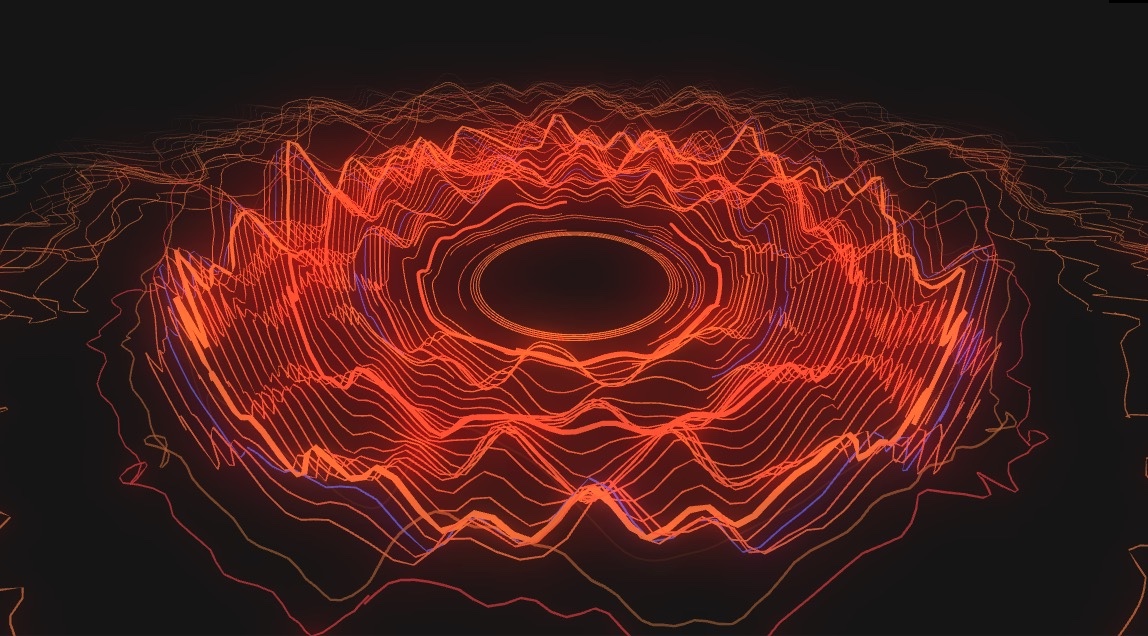
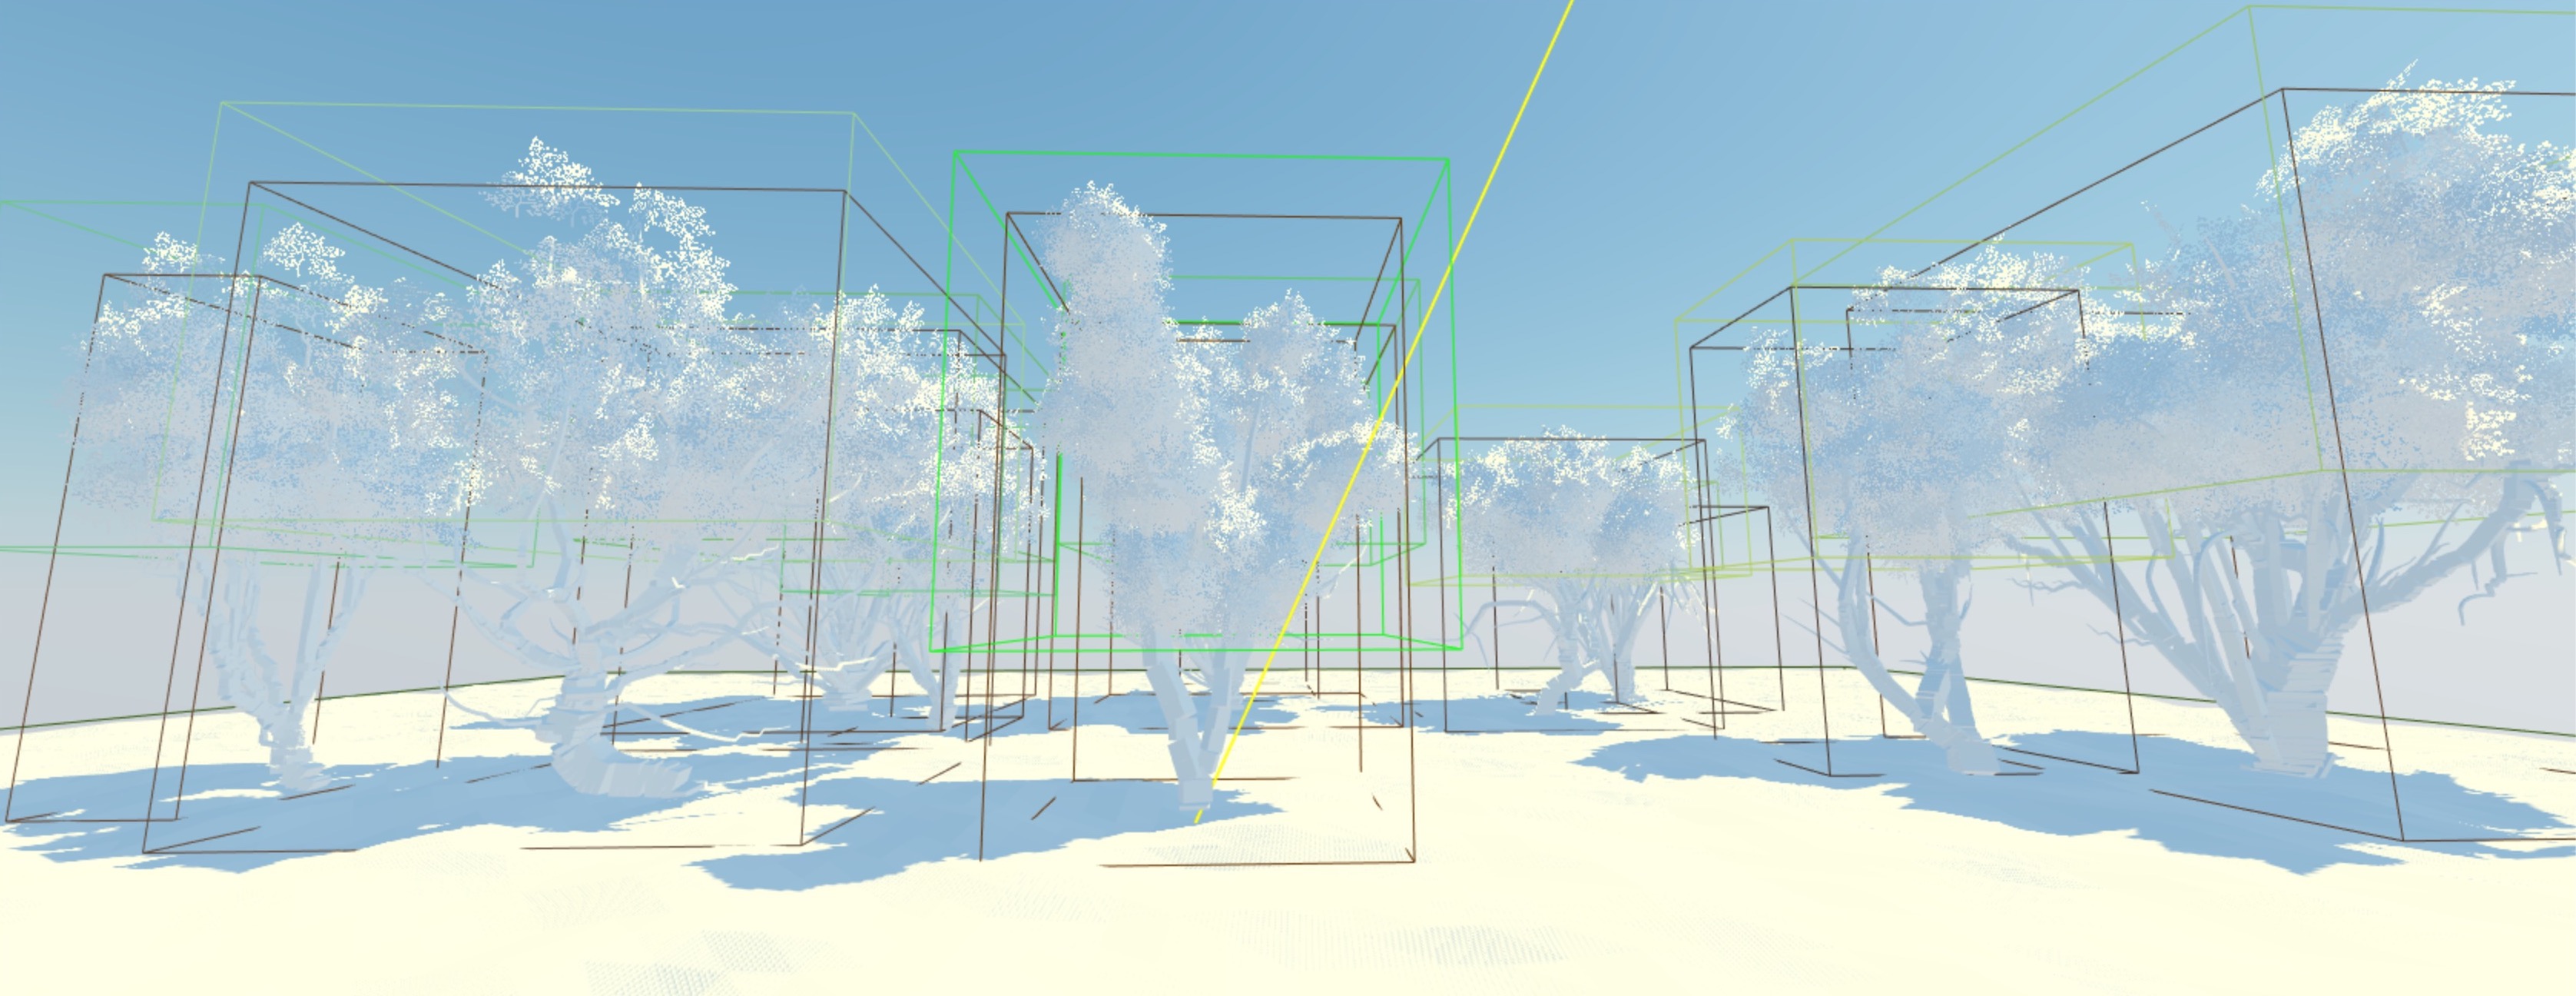
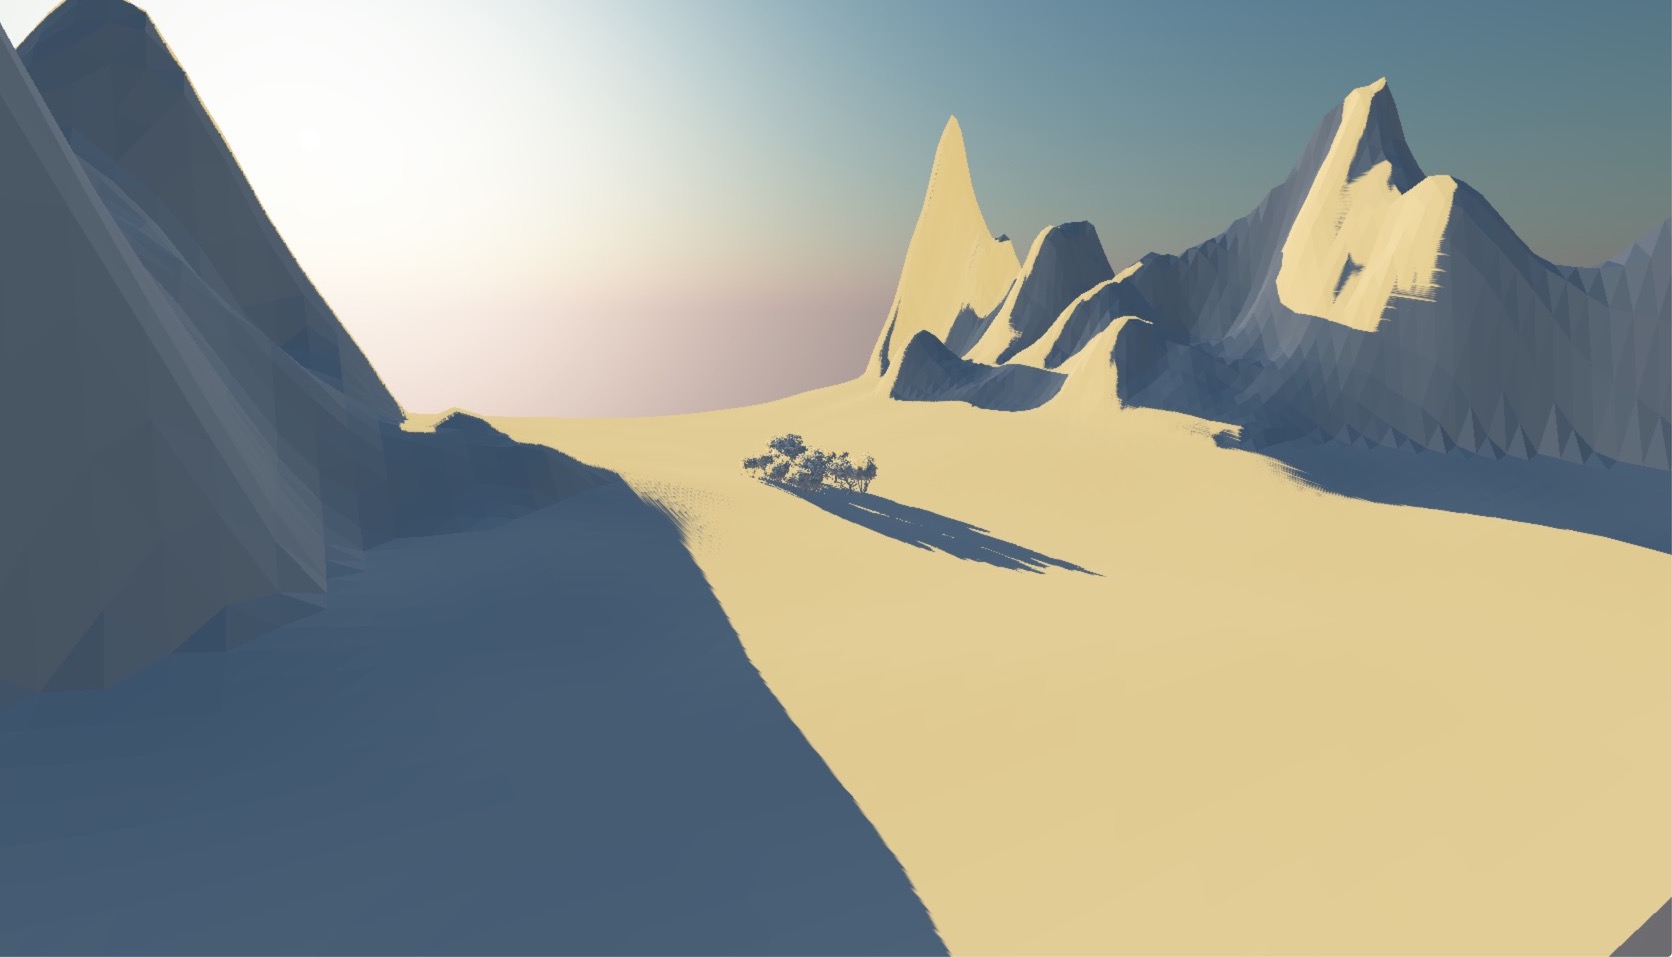
By now you probably wonder where the cover image comes from. It's a WebGL project we started at the end of 2016 and can't wait to tell you more about it in the coming months. Some sneak-peak screenshots below.
Videos
In 2016 we started a video series highlighting common threads across our work. The first video Growth is a collage of different growth algorithms we explored over the last few years.
Talks
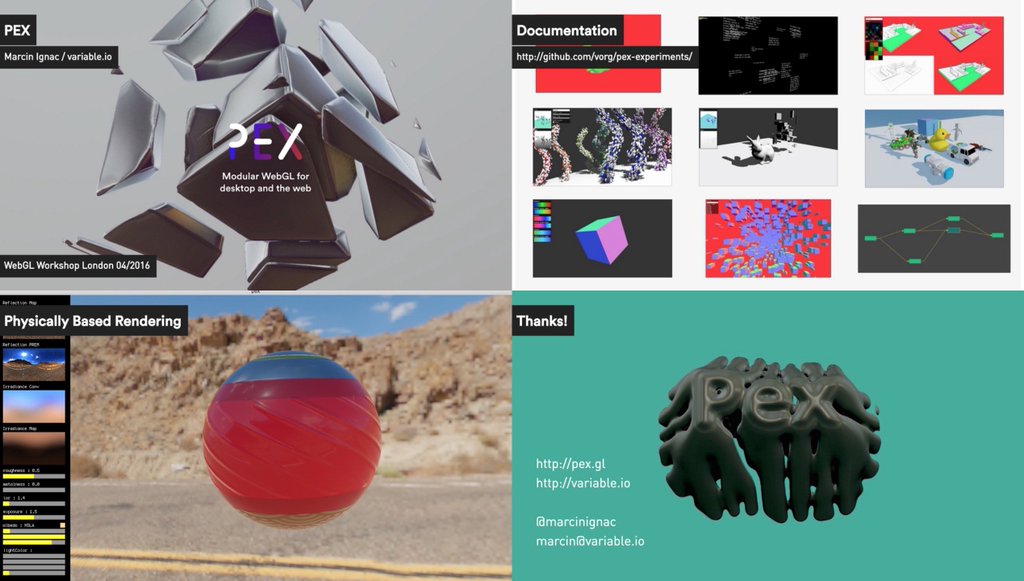
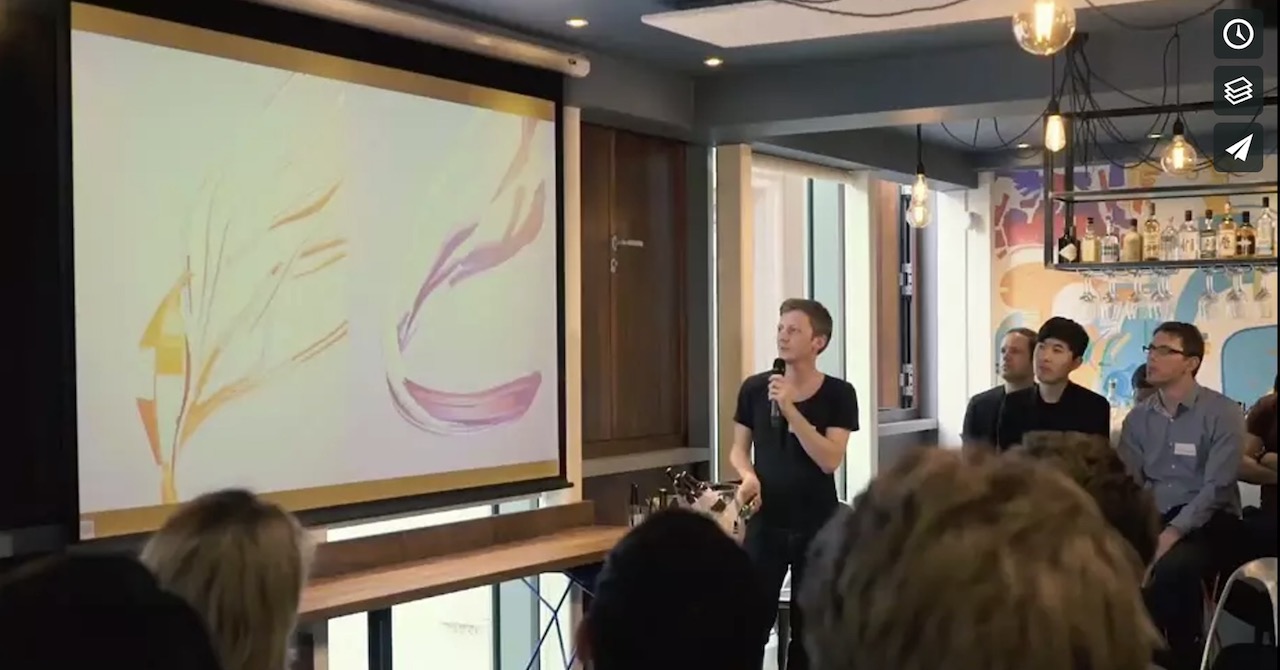
Modular WebGL with Pex at WebGL Workshop Meetup, I talked about PEX, our JavaScript 3D Library, challenges of modular graphics engine and the progress of our physically based rendering pipeline. London, UK.
Data Is Not A Number at Shack 15 data science hub I talked about data that can be experience not only counted. London, UK.
Meta Design at Krakatoa talk club I discussed computational thinking and role of meta design conceptual tools like layers of abstraction or emergence. I was invited by Mlady Pes studio. Bratislava, SK.
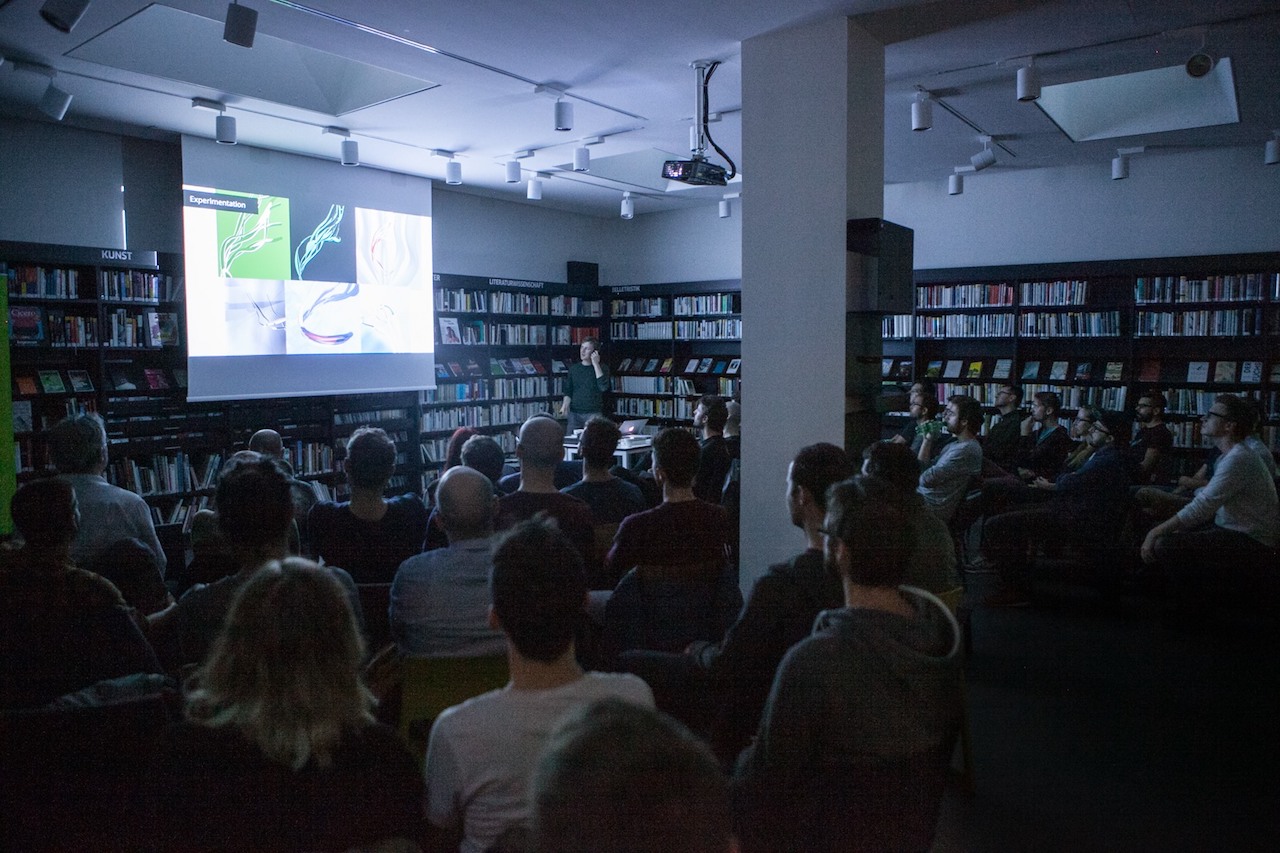
I also talked about Understanding The World Through Code at Mira Festival in Barcelona and Visualizing Invisible Systems at DataViz London Meetup in London.
Workshops
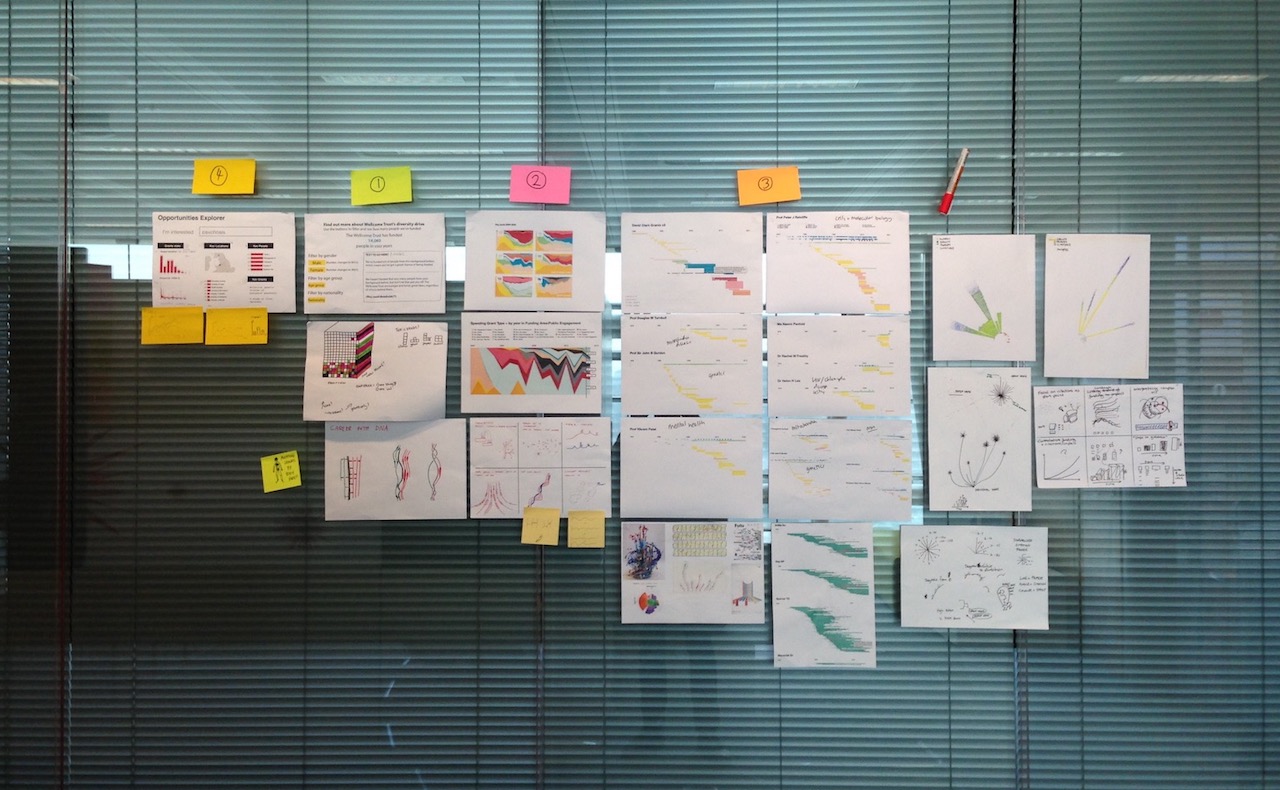
Wellcome Trust R&D - We ran a 2-week intensive R&D session together with the WT web team and data journalist Joanna Scott, we explored new ways of visualizing vast collection of data that Wellcome Trust activities are generating.
Defining the Scholarly Commons: Reimagining Research Communication at Force11 Workshop I was facilitating and visualizing ideas about the future of Research Communication. Madrid, ES.
Technology is not Neutral - Together with Julie Freeman we ran a half-day intro to data art workshop at Watermans Centre. After brief introduction to our work, programming concepts and the data behind the RAT project each participant created a sketch responding to molerat activity streamed from OpenSensors.io. We used a new version of OpenProcessing.org to run the workshop, not without glitches but forking was nice.
Tech
PEX - is a set of JavaScript/WebGL libraries for computational thinking. Currently at version 2 in production.
3rd party tech we discovered this year:
regl - functional WebGL library, vastly helping manging WebGL state. We are currently experimenting with making using ideas from regl as a core component of the next version of PEX.
Jupyter + iJavaScript for data explorations in a notebook format. Instead of write, run, test and repeat loop we used Jupyter to evolve our data viz exploration as a series of sketches.
Tachyons - functional CSS, a crazy idea not easy to grasp at the beginning but proved immensely time saving in the long run.
Choo - mini React-like library for those with JavaScript framework fatigue.
Videos
In the yearly influx or projects sometimes is good to stop and reflect what are the common threads between them. This is how our first video collage came to life: Growth - a collection of different growth algorithms we explored during the last few years.
2017
- User research using bots?
- Your data traces in VR?
- Machine learning for generative design?
Here we come!
Cheers. Live long and prosper.
- Marcin, Feb 10th, 2017