This is the third case study for our project GSK - Visualising Advanced Technology
Introduction
In the summer of 2020 we delivered a long project for the multinational Pharmaceutical company GlaxoSmithKline, you can find the case study for that project here.
In this article we are going to focus on the ways our inhouse creative coding tool, Nodes, empowered us in this project and showcase some of the real-world uses it has in the modern studio and workflow.
For some background on Nodes, you can find the story of its inception here

Realtime shading of experimental geometry
Recently at variable we built a pipeline for moving assets between SideFX Houdini and WebGL.
As Houdini is focused on path tracing, the development of shaders and then rendering of high quality video can be very time consuming. Each variation has to be rendered frame by frame in high enough quality for presentation, the high number of path-traced samples required to acheive the quality required was far to time consuming for a project with a tight deadline. One way we speed up this process is to export particle or geometry data from Houdini and experiment with shading/lighting/texture work in realtime in Nodes. We usually export these as obj meshes straight from Houdini and for point clouds especially we usually store additional data in point uvs and normals for use within Nodes.
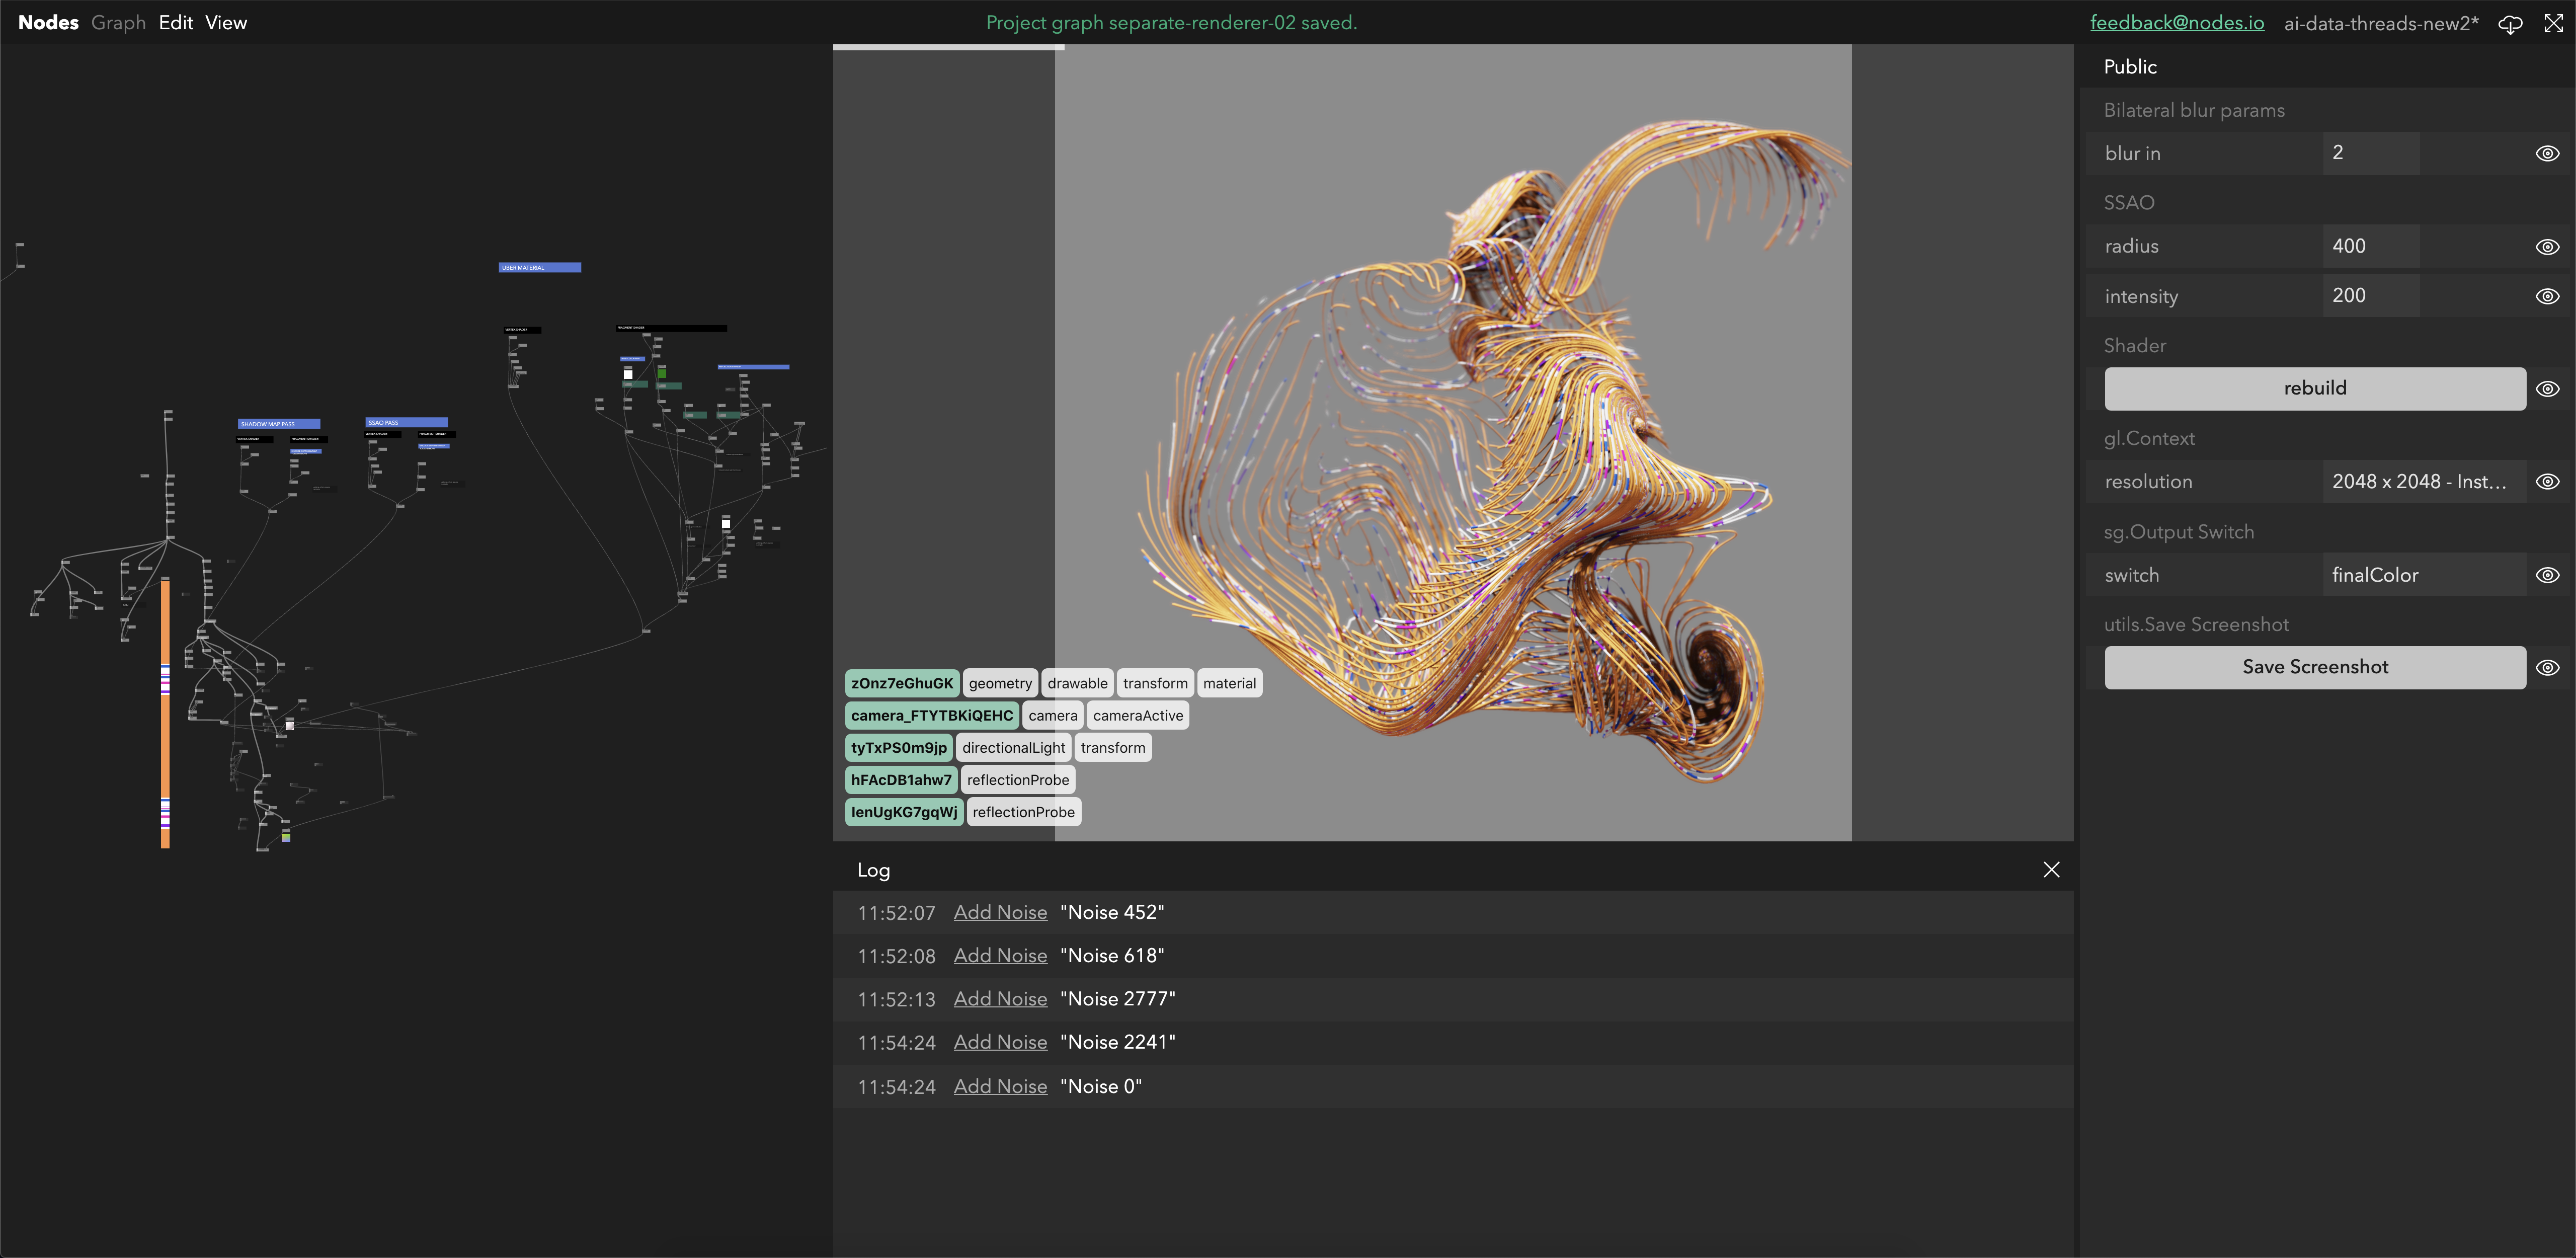
We mostly use pex-renderer, our open source physically based renderer with the geometry output from Houdini. A big advantage of pex-renderer are its built in rendering featues such as Directional Lighting, DOF, SSAO, gamma correction & tonemapping allowing us to produce very high quality results without too much time spent.


Hybrid generative systems using Houdini and WebGL
Sometimes we want to use the complex generative tools in Houdini to create meshes and datastructures that we can use to help power realtime animations. One common example of this is the Houdini point cloud system. There are powerful offline-focused processing tools in the houdini nodes that we want to take advantage of for our realtime work.
When we want to move static point clouds between Houdini and Nodes our go to system was to use the obj format. We have a robust obj loader that outputs our geometry as simple arrays that we can pass straight to pex renderer. Because it creates such an easy to manipulate datastructure we can pass additional data between Houdini and Nodes by packing additional info into the uvs and normals.
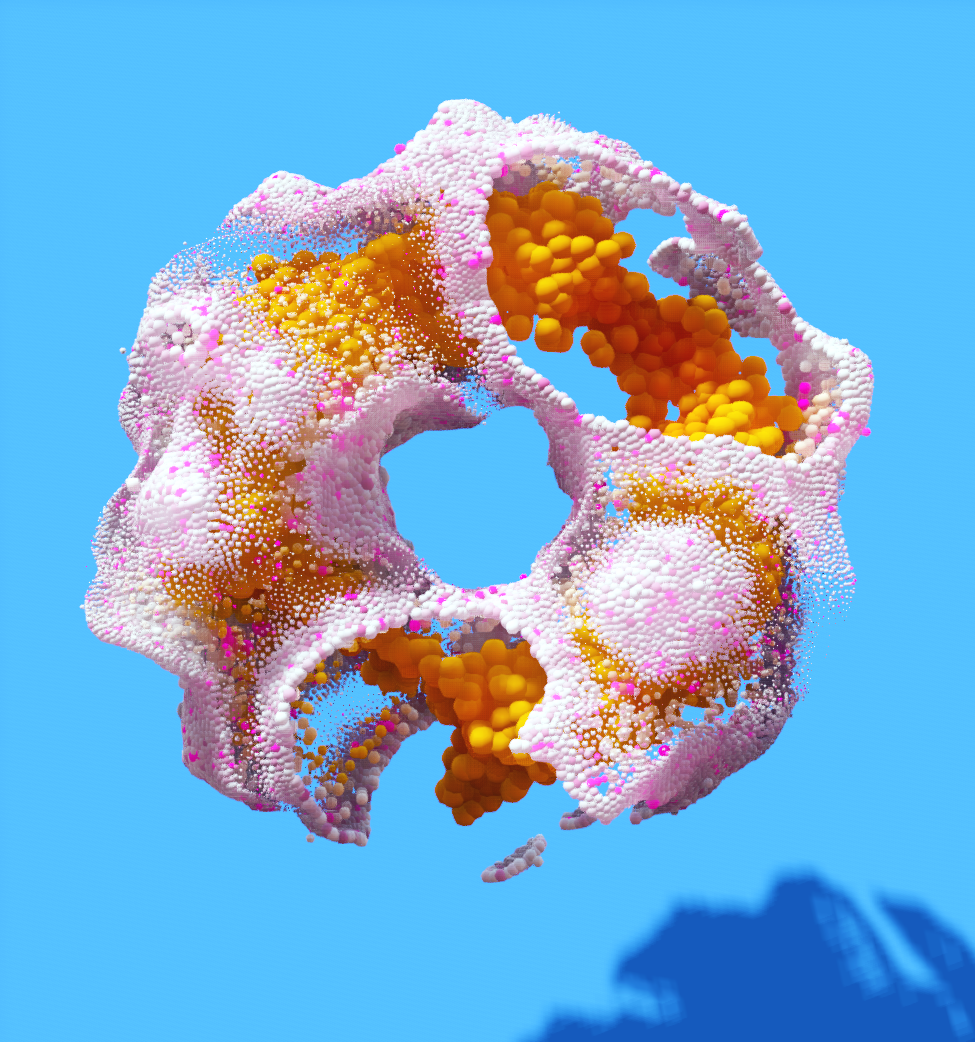
One of the systems we used this for was when we wanted to know the depth of a point within a structure. This can be calculated using SDF's in Houdini but would be time consuming and expensive to compute in realtime. To get this value into Nodes we normalise the depth value, and assign the Normal values to this. Theoretically you could store different data in different channels allowing passing 5 float values per point (N[x], N[y], N[z], Uv[0], Uv[1]), but we rarely use all these channels.
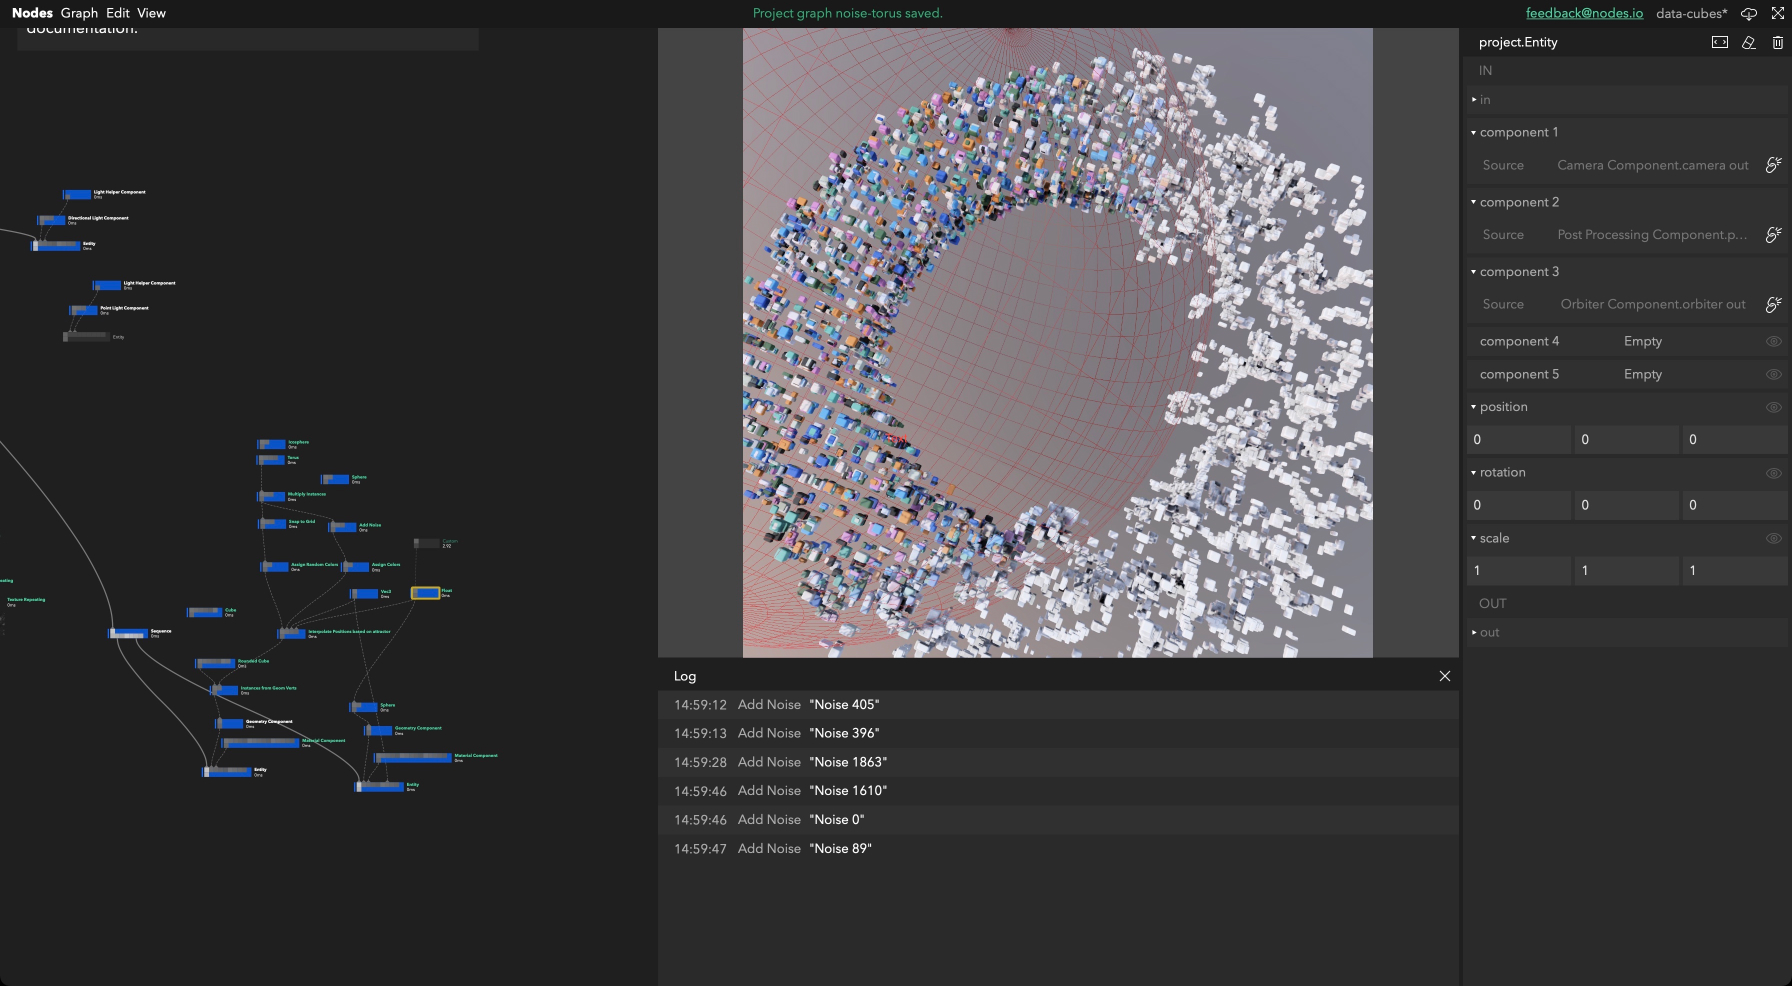
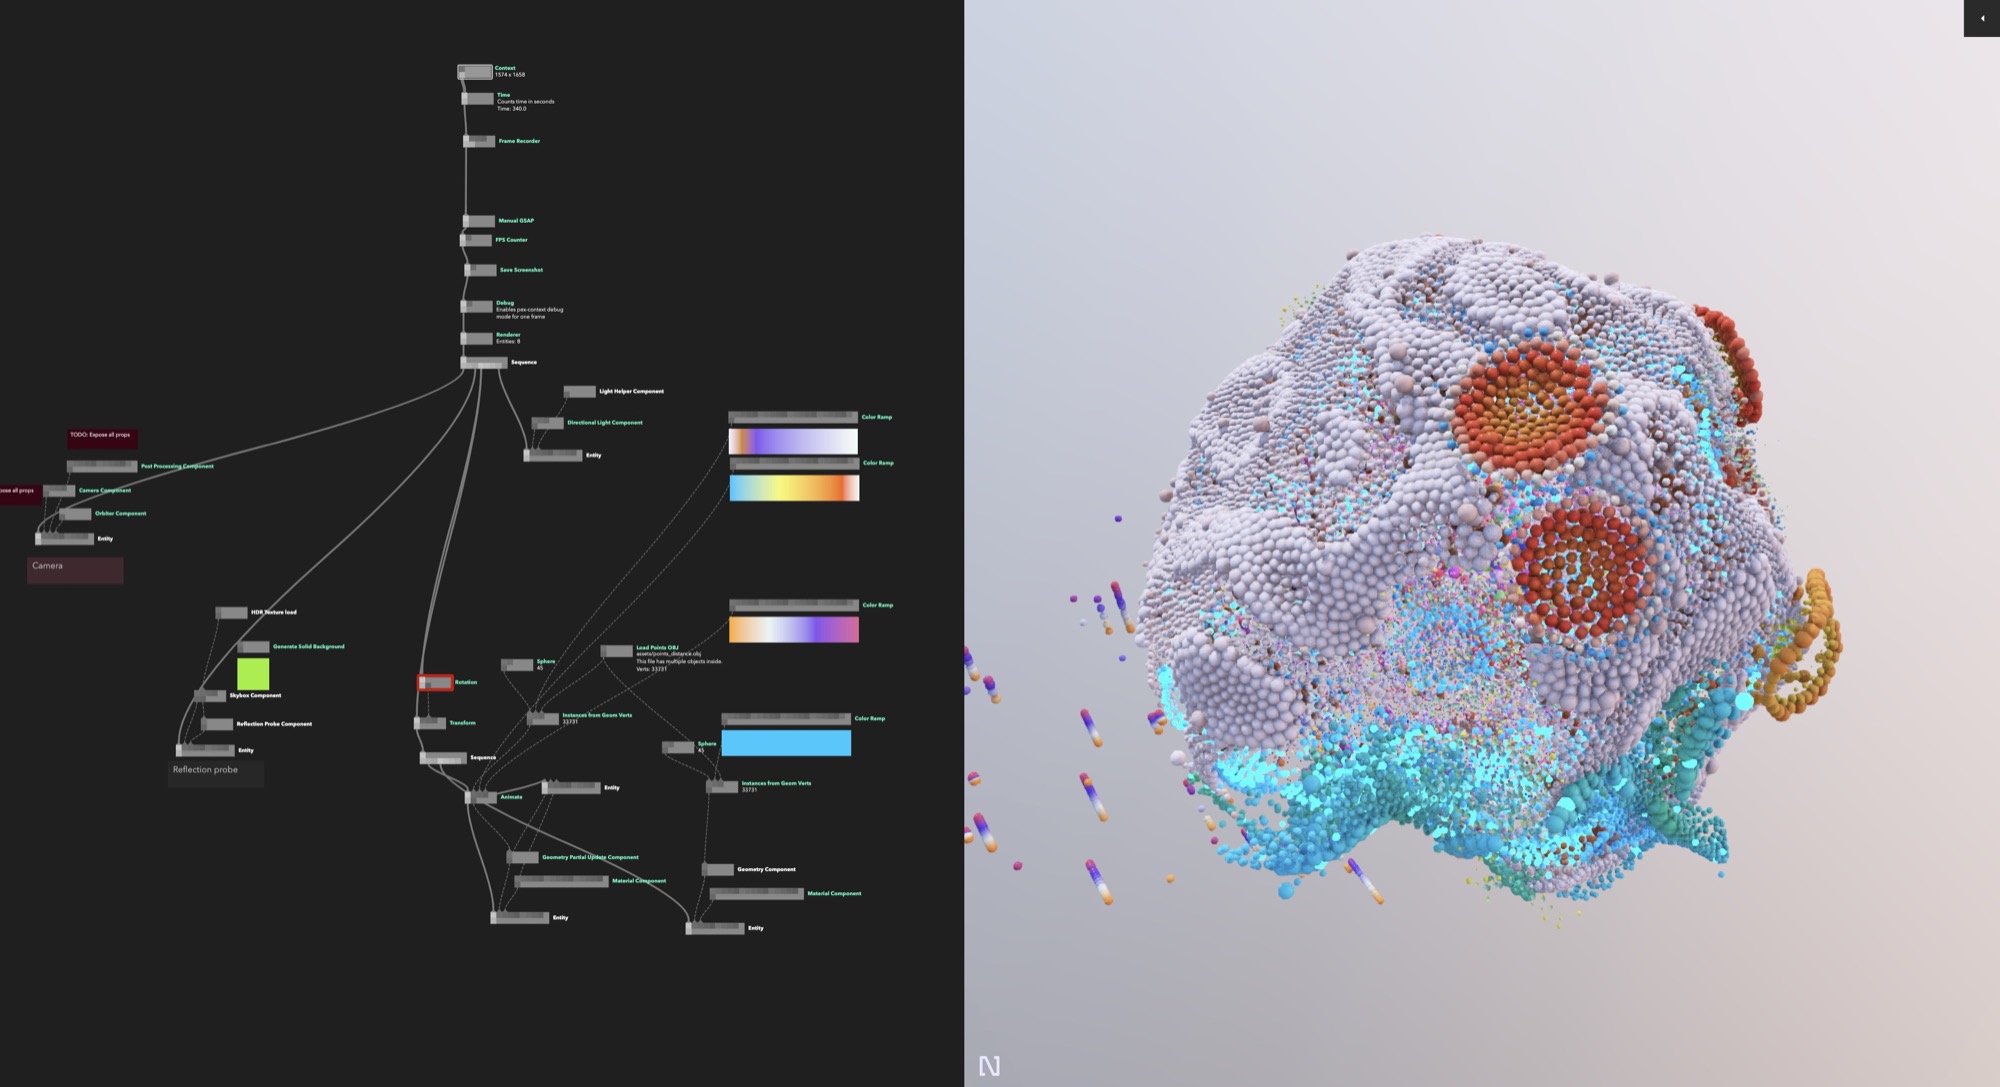
We have created a Nodes playground example where you can see how we manipulate the depth value to color the points from a color ramp function. The shape we used here ended up being quite simple but we add any shape exported from this Houdini pipeline into the Nodes graph and it will work. Pex-renderer has quite simple instancing support that works by passing a geometry and the positions,rotations,scales and colors you want to the instances to be displayed using, You can see in the 'Instances from geom verts' node (double click to open) we take the Normal value from the pased obj and build the instance object here.
You can find the playground link here! feel free to explore the whole system, comments have been left in the graph explaining what each part does and we hope its useful for those learning to use Nodes themselves.

The above playground is an embedded copy of Nodes; you can open and close nodes to read the code and correct or disconnect ports.
For more complex particle simulations we can cache the entire simulation within Houdini. By using a modified version of the HouThreeNi exporter and a custom node we can use the TRS matrices of each point to replay the caches simulation. Although useful we didnt use this system too much in this project.
Generative art using only WebGL
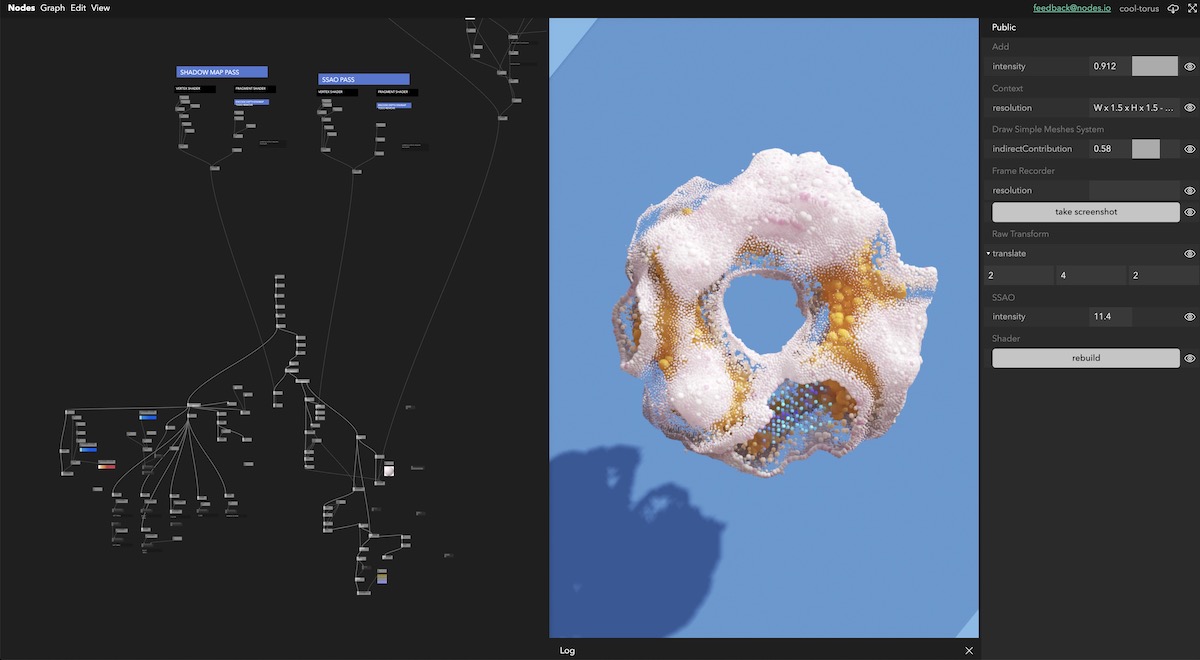
At Variable our main usecase for Nodes is creating generative art using WebGL. For this we primarily use PEX libraries for low level WebGL and build custom systems per project for maximum performance. One of the systems we made for this project was a generative and parametric planet based off the idea of a world with a data core and and algorithmic surface.The rendering and geometry were all created within Nodes, and used the built-in inspector to create parameters that could be changed to create a large variety of outputs from the same generative system.
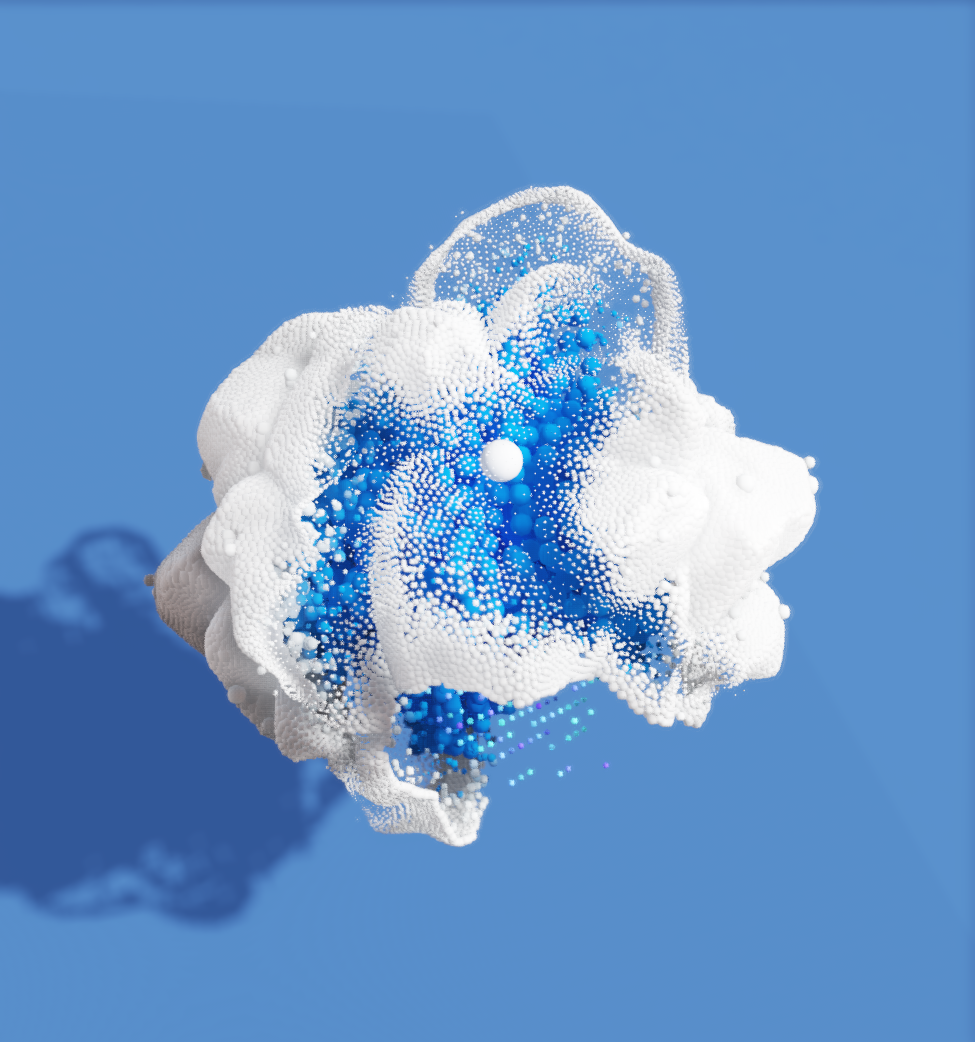
In first two examples below we calculate spheres of influence around control points in reatime, and modify object color and point position based on the proximity to the control points. Most of our examples are using instances of a sphere mesh, as its properties are controlled with simple arrays we can create motion prototypes quickly that are performant, and because theyre realtime we dont have to lose a lot of time and budget on offline rendering.
The example below is a custom system written in pex-context, our open source low level WebGL resource management library. This system works using a noise driven GPGPU setup, for each frame current positions are written into a texture, this way have the history of that every point position over the last x frames. By passing these positions to a custom shader network we can efficiently draw lines in realtime by instancing a capsule along the path.
Data Visualisation
As Nodes is javascript based and uses browser technology it has access to all the powerful API’s that come with the web. This means you can very quickly create simple data visualisations like these using the HTML5 2D Canvas.

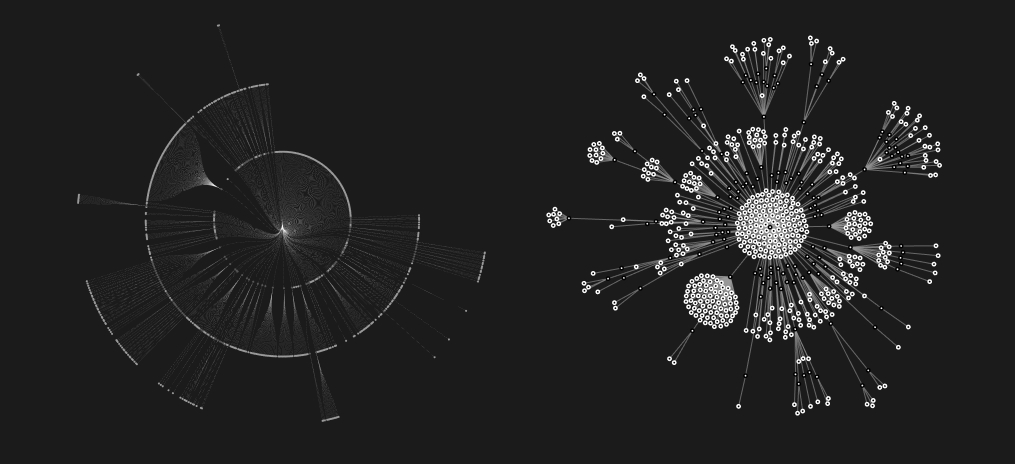
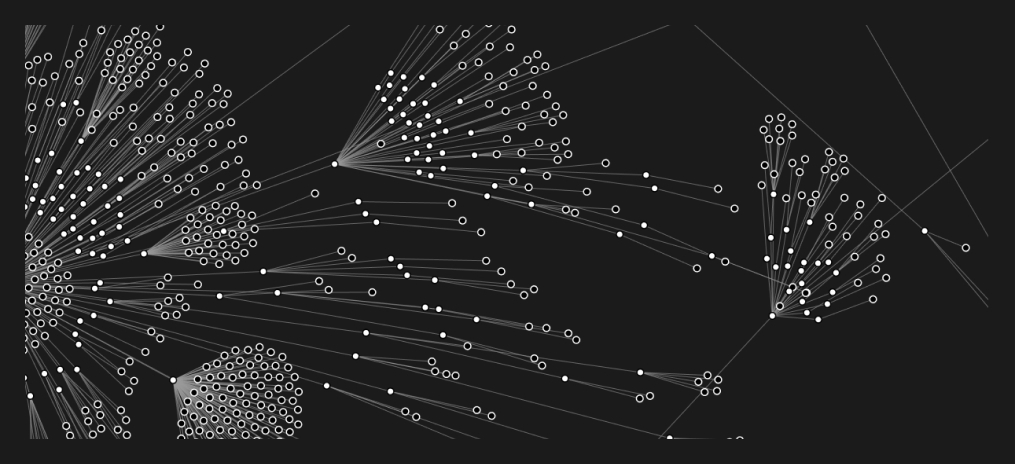
Data Visualisation - Using D3.js
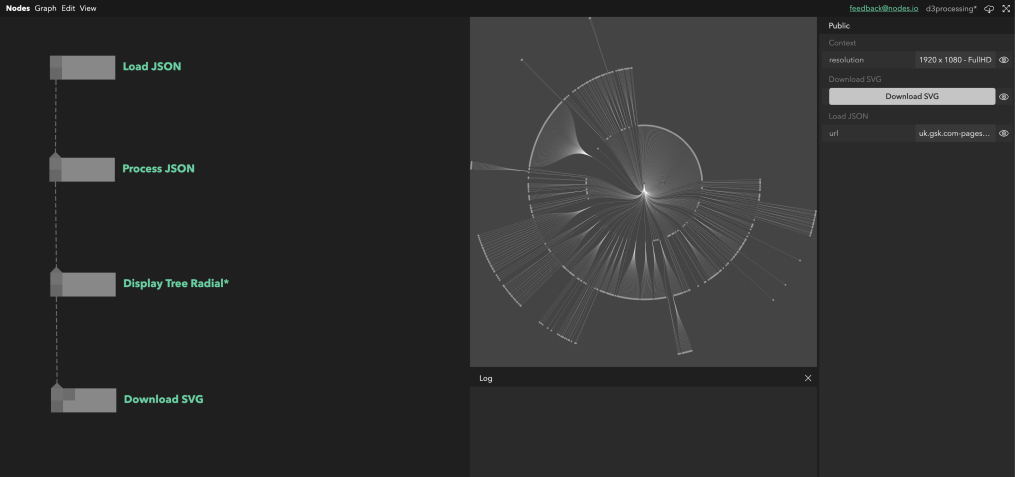
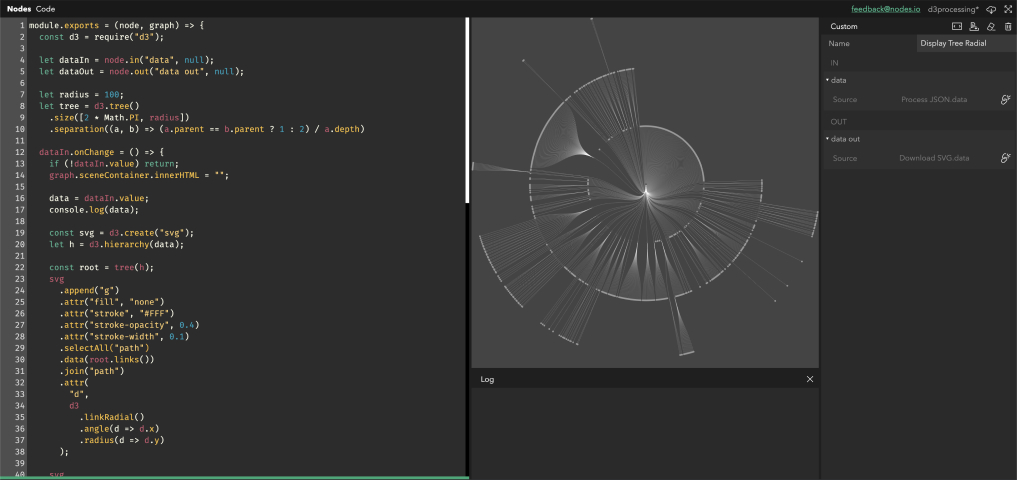
Although we usually make our own tools from scratch one library we use often is D3.js for our data visualisation. When we wanted to visualise sitemaps as radial trees we simply import the d3 packages required and build the data scructure that is needed for the visualisation. We also did force directed graphs in a similar way. The centre of each graph is its homepage and each child is a link, with its children being the links on those pages. This makes an effective tree-map of the whole public facing website, hoping to echo the structure of the company. On the Nodes.io website we have a live playground example to showcase how you can use D3.js with nodes.
Data Visualisation - Using tsne-js
An algorithm we find ourselves using more and more is t-SNE, used for finding patterns in high dimensional data it can be useful in helping us see the shape of large or complex datasets. For smaller datasets we use tsne-js within Nodes and do all computation purely within the app using either Cavas2D or WebGL to show output. One peice of complexity here is that because Nodes is a Javascript electron app all the UI elements run on the same thread as the processing being done. The processing for tsne-js is very heavy and would cause the app to freeze while processing. We can get round this using generator functions, running each epoch of the ML manually and when the loop has been running for an amount of time we deem acceptable we break the loop and continue next frame. As we start using heavier and heavier machine learning algorythms in the browser this pattern is becoming more and more widely used in our explorations. This is only feasable to a certain extent however and or more complex or very large datasets we use other, often python based, libraries for the calculation and then import the outputs into Nodes and use Nodes purely for the visualisation.


You can try Nodes now
So hopefully this gave you some insight so some of the ways that we use Nodes within Variable for our day to day, even if it isn’t final media output that the project requires.
If you want to stay up to date about public releases of Nodes you can sign up to our newsletter at Nodes.io or follow us on twitter @nodes_io
See also
Are you interested in representing your data in a new way? Learn more about Generative and Data Driven Art, Data Visualisation R&D, or contact us and say hello.


