This is the second case study for our project GSK - Visualising Advanced Technology
Developing the art
The genertive systems and prototypes we've created were built in a combination of SideFX Houdini and in Nodes, our in-house nodes based design and coding tool.
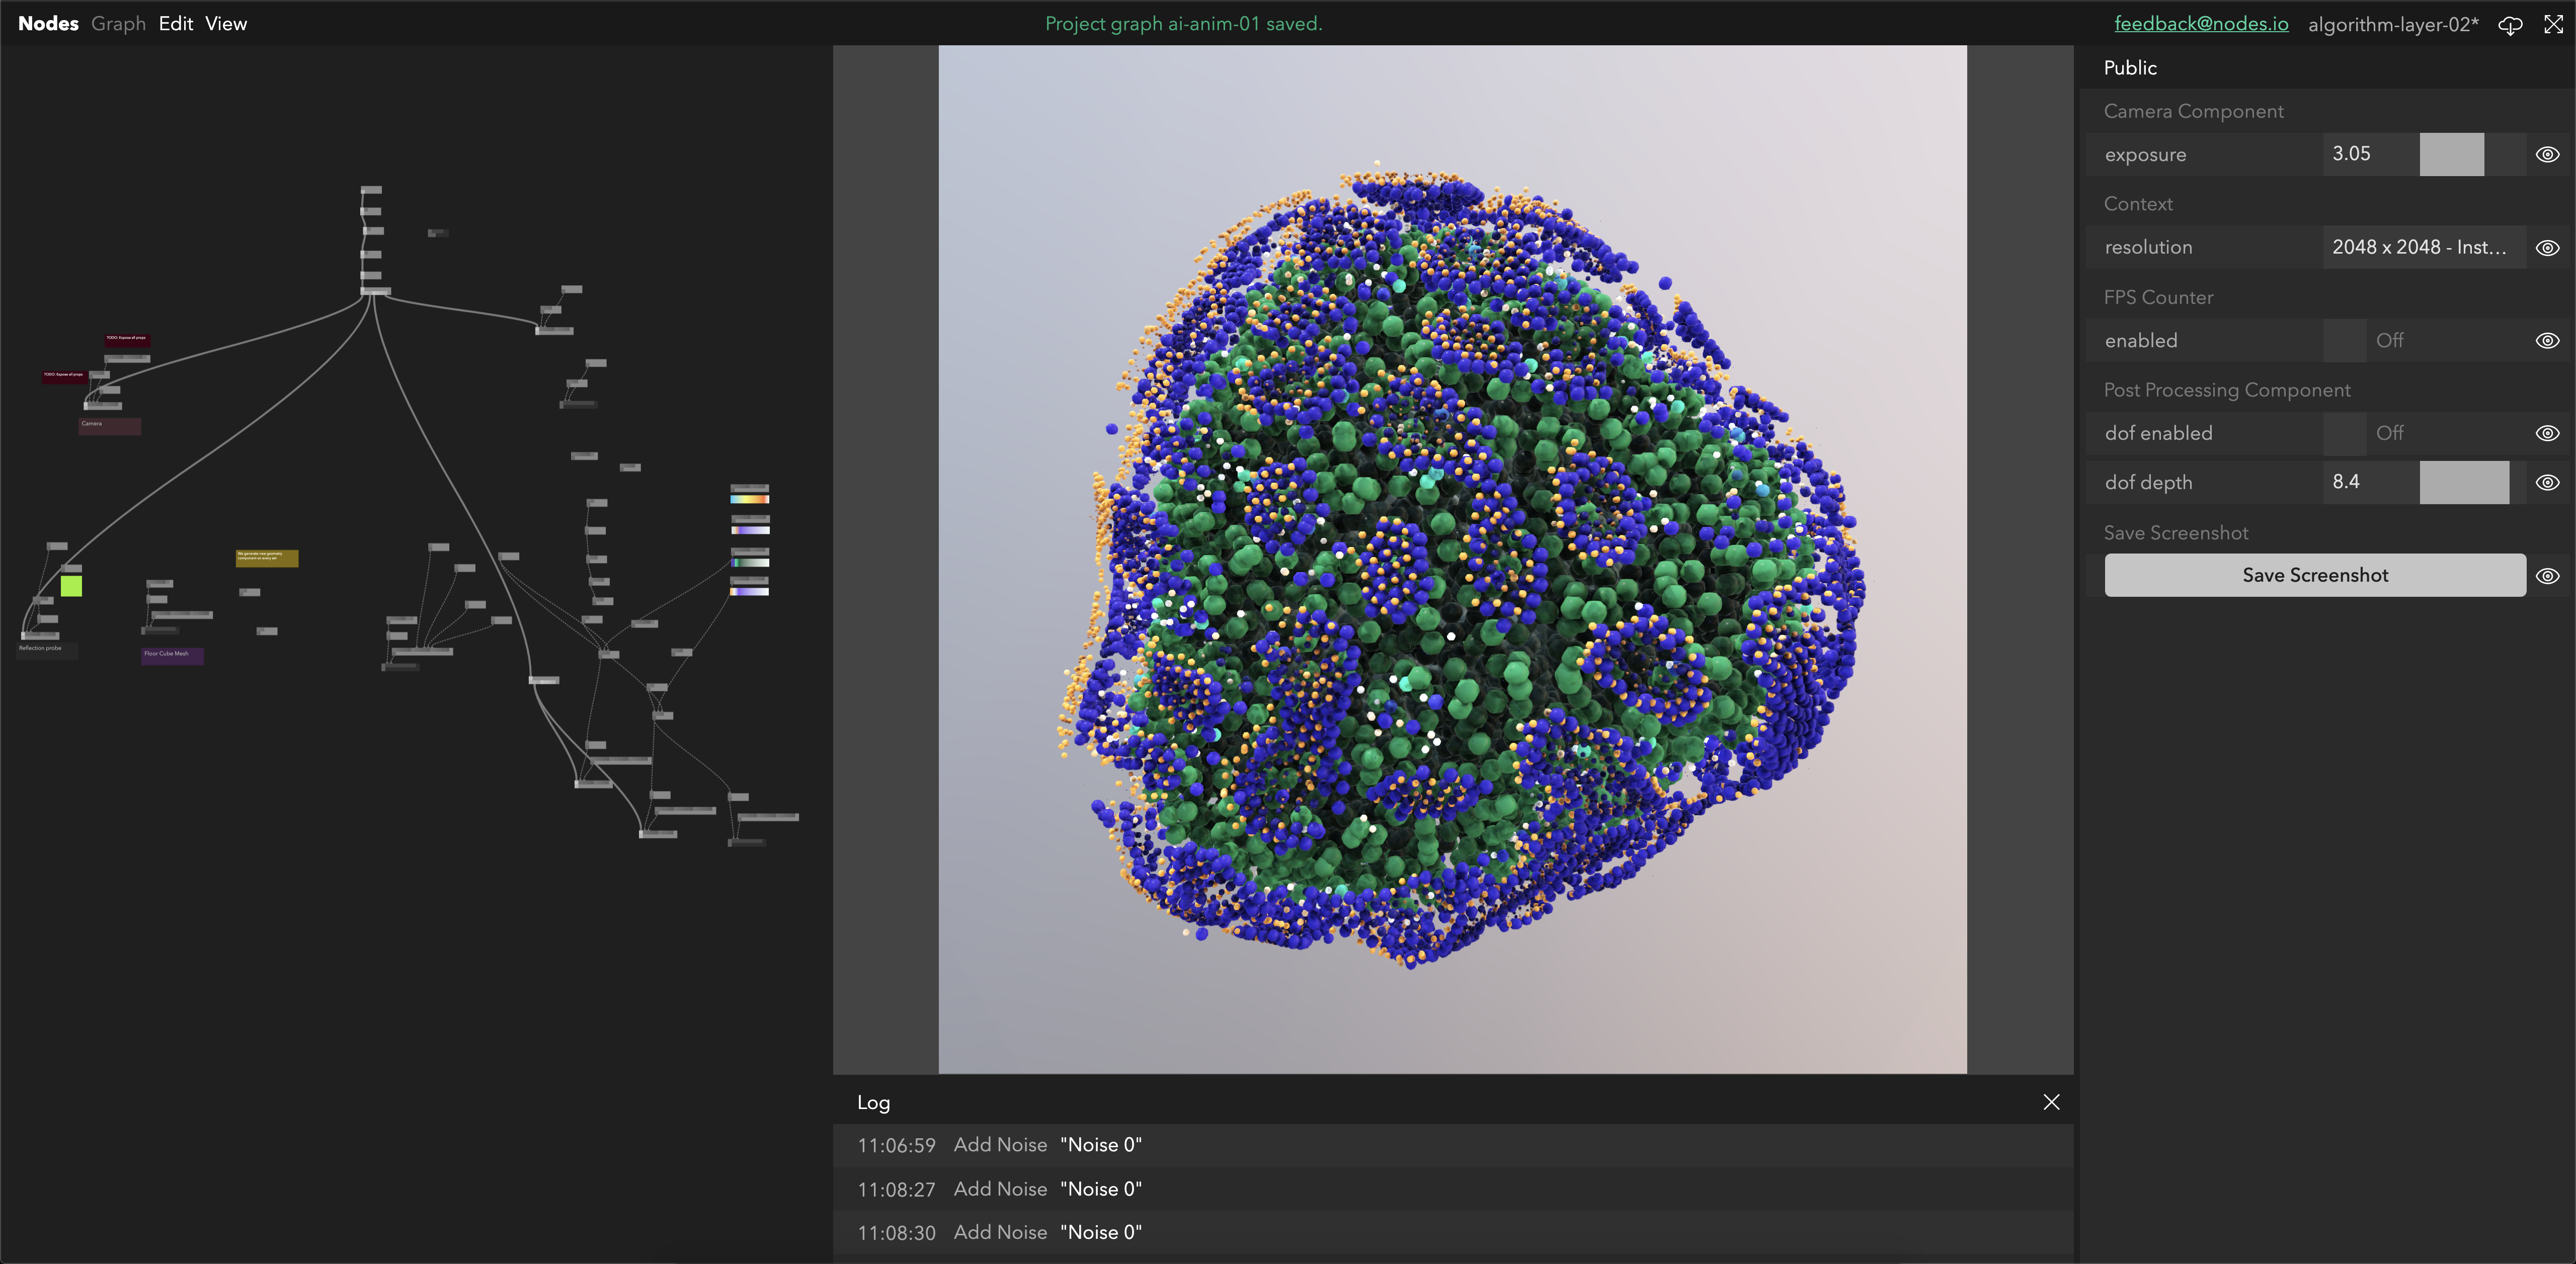
During prototyping Nodes and WebGL really shone as a way to quickly test shapes, colors and forms of outputs. Real-time systems are unmatched with rendering speed, and parametric systems built in Nodes.io were crucial to delivering this project quickly and efficiently.
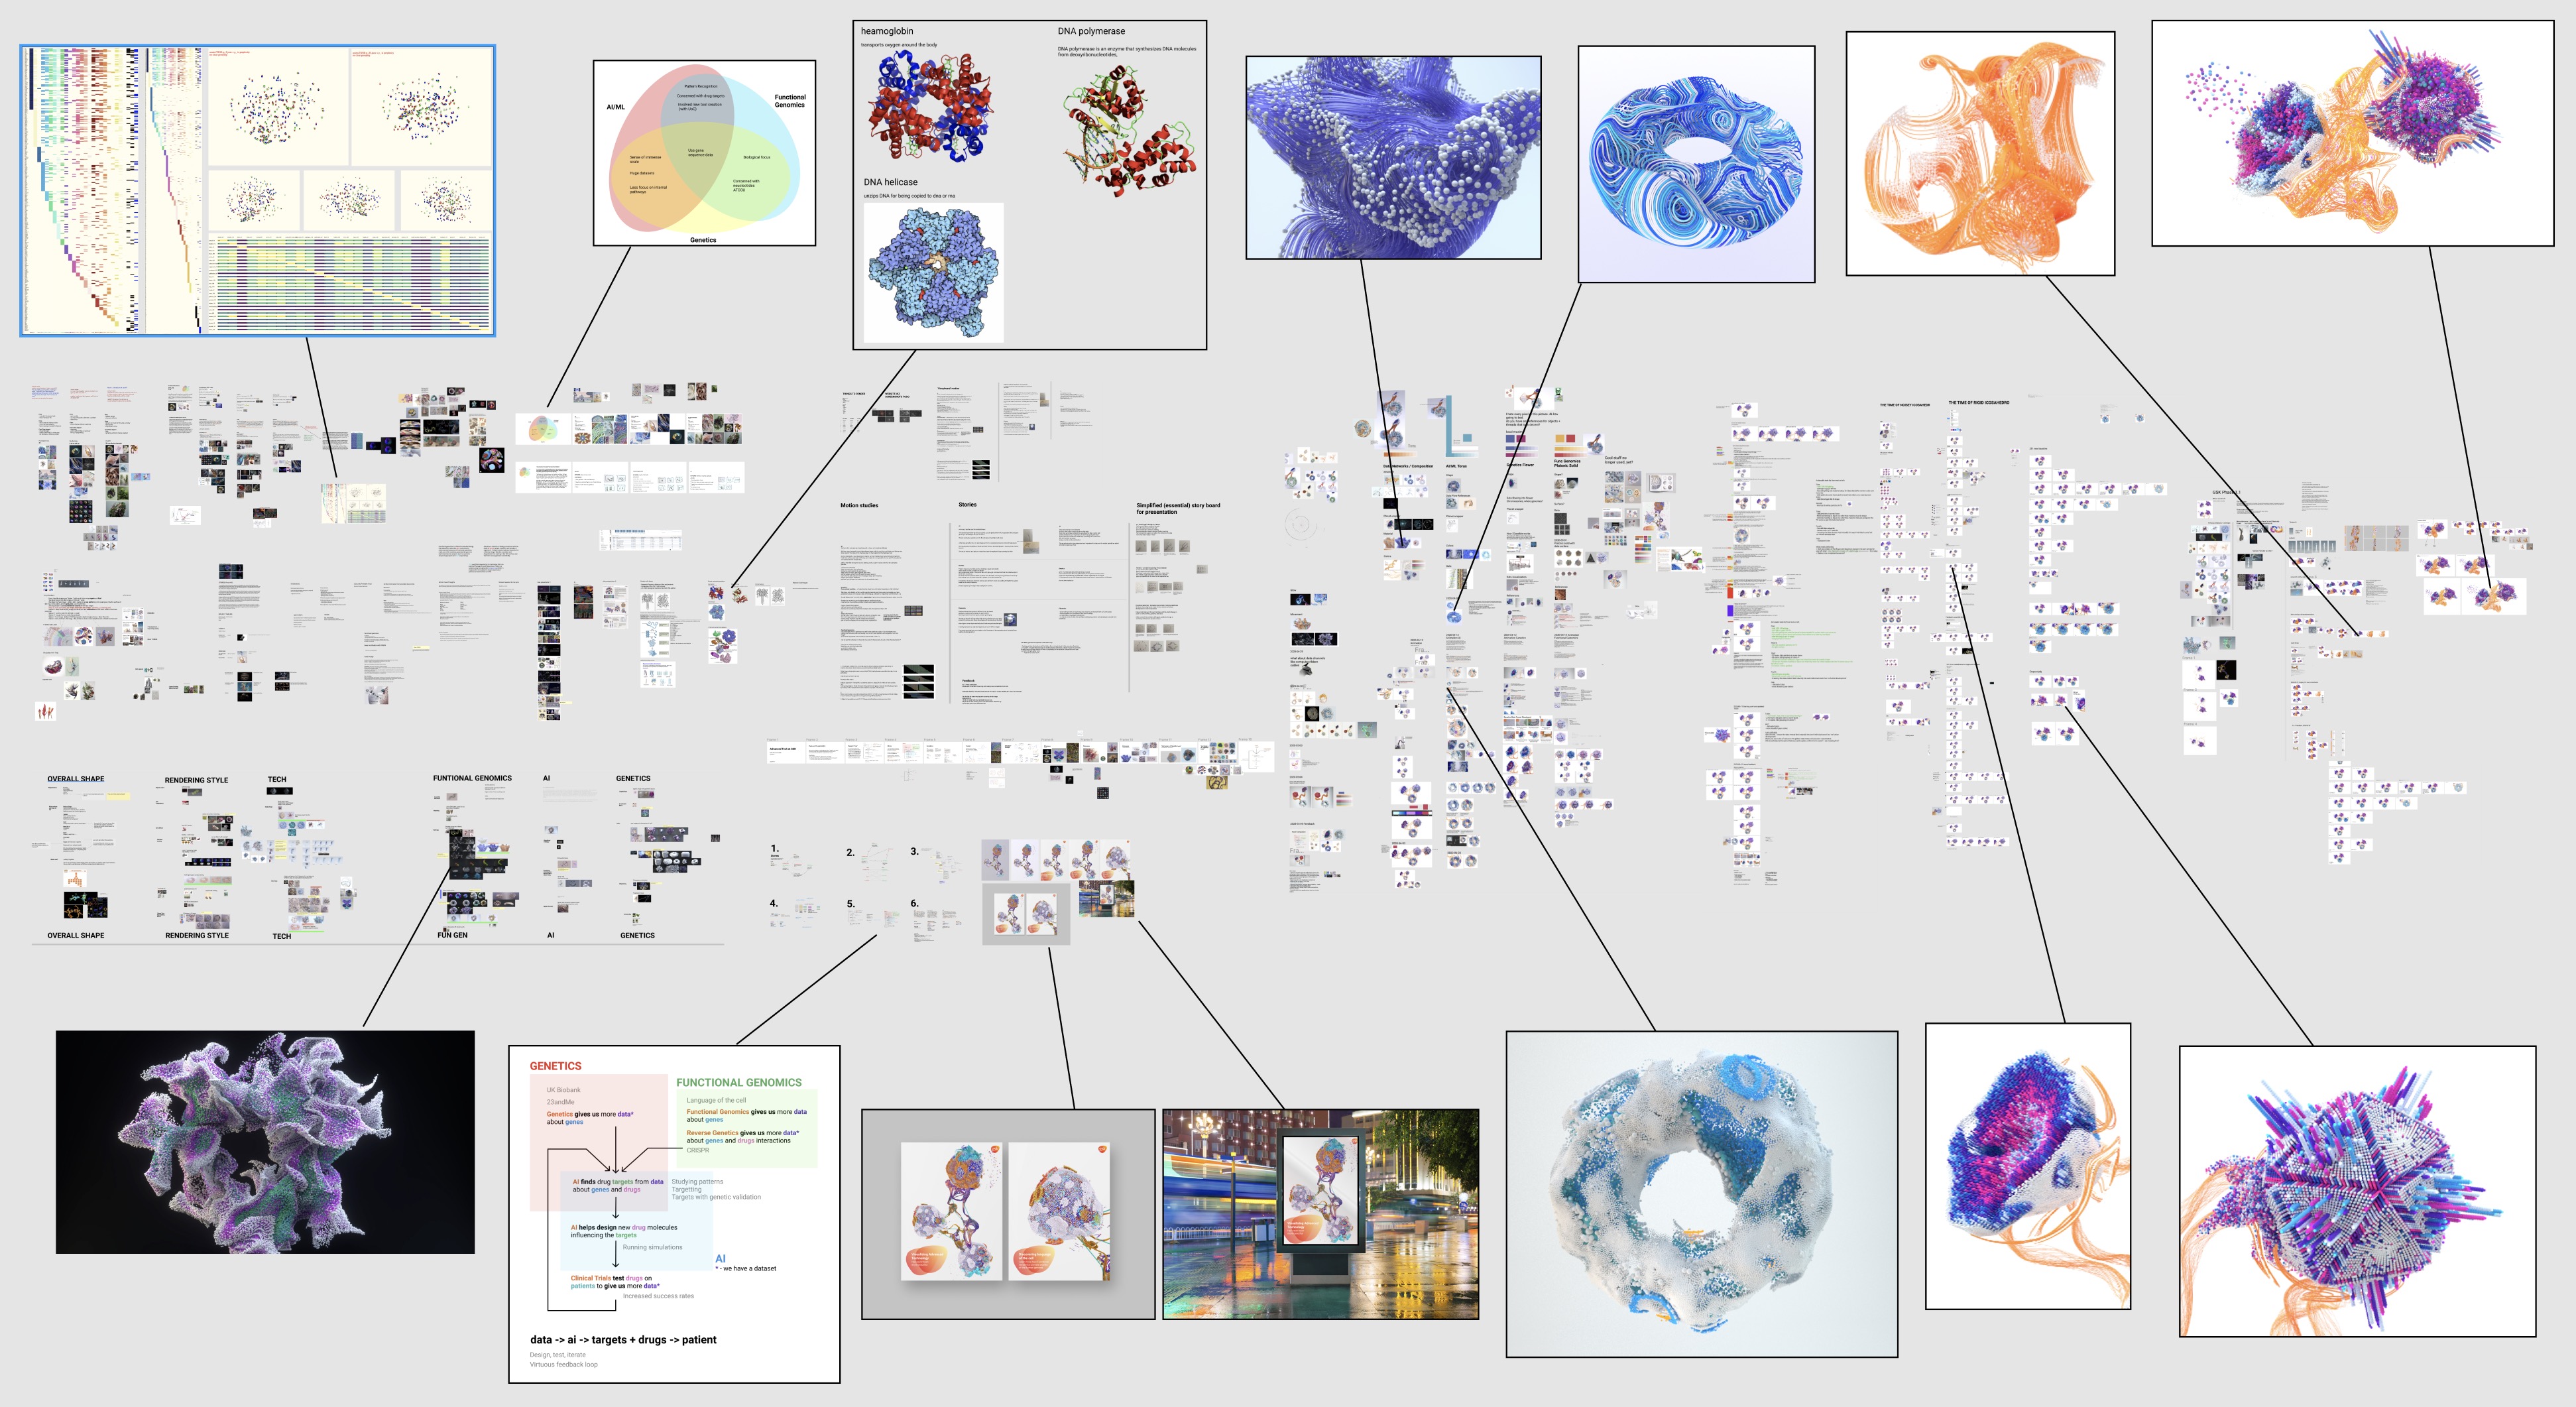
This was a long project with many simultaneous advancements thats we have tried to break down into sections where you can see progress, There is, however, overlap in all of these as we were building a complete system so you will likely see other common visual advancements across all sections.
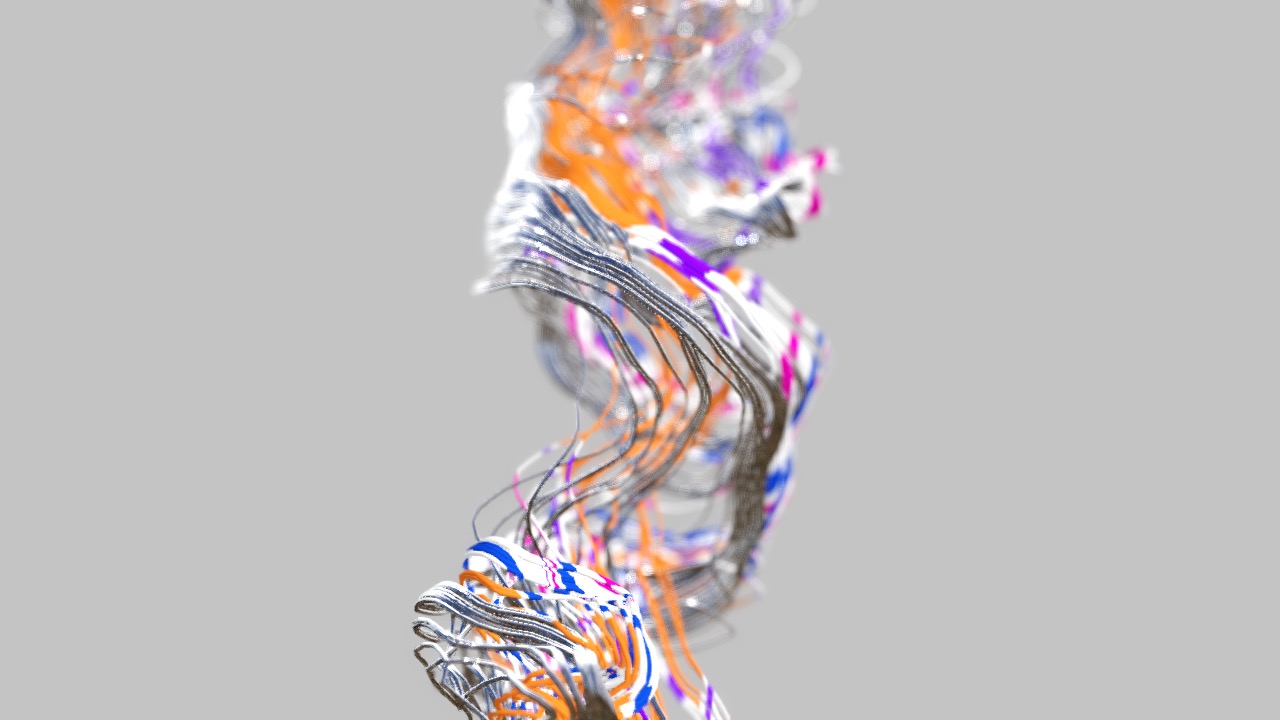
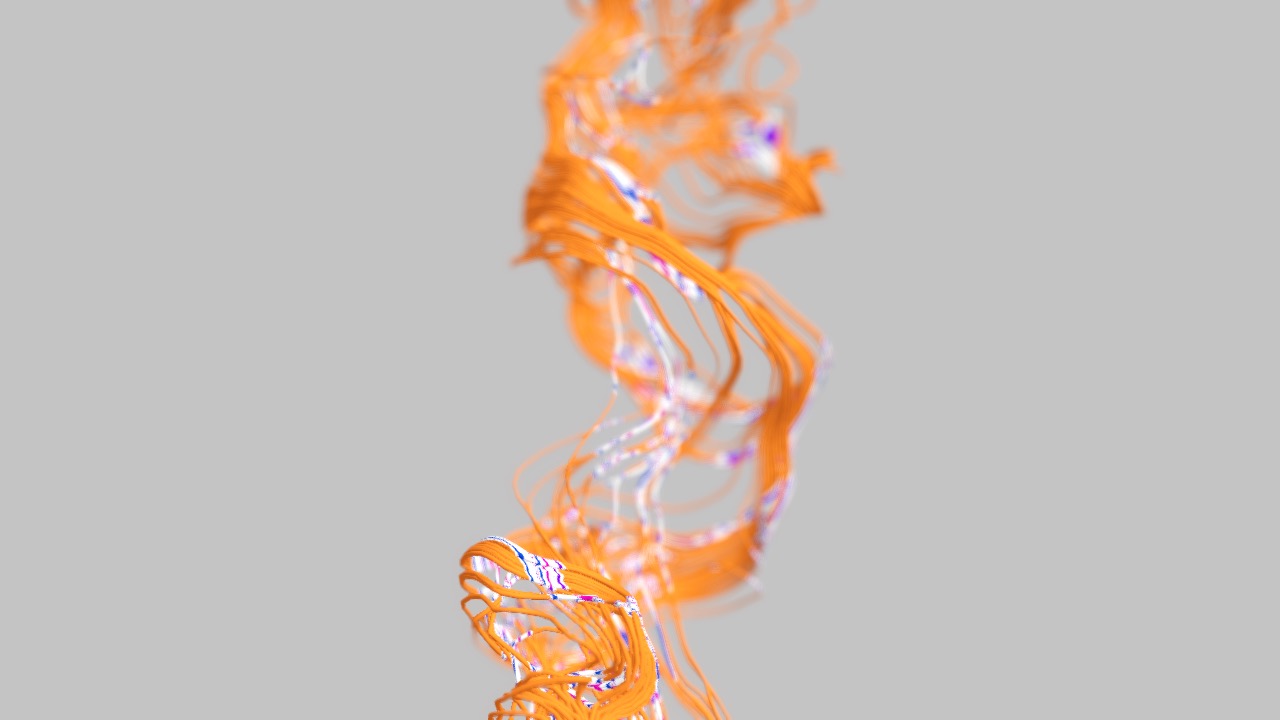
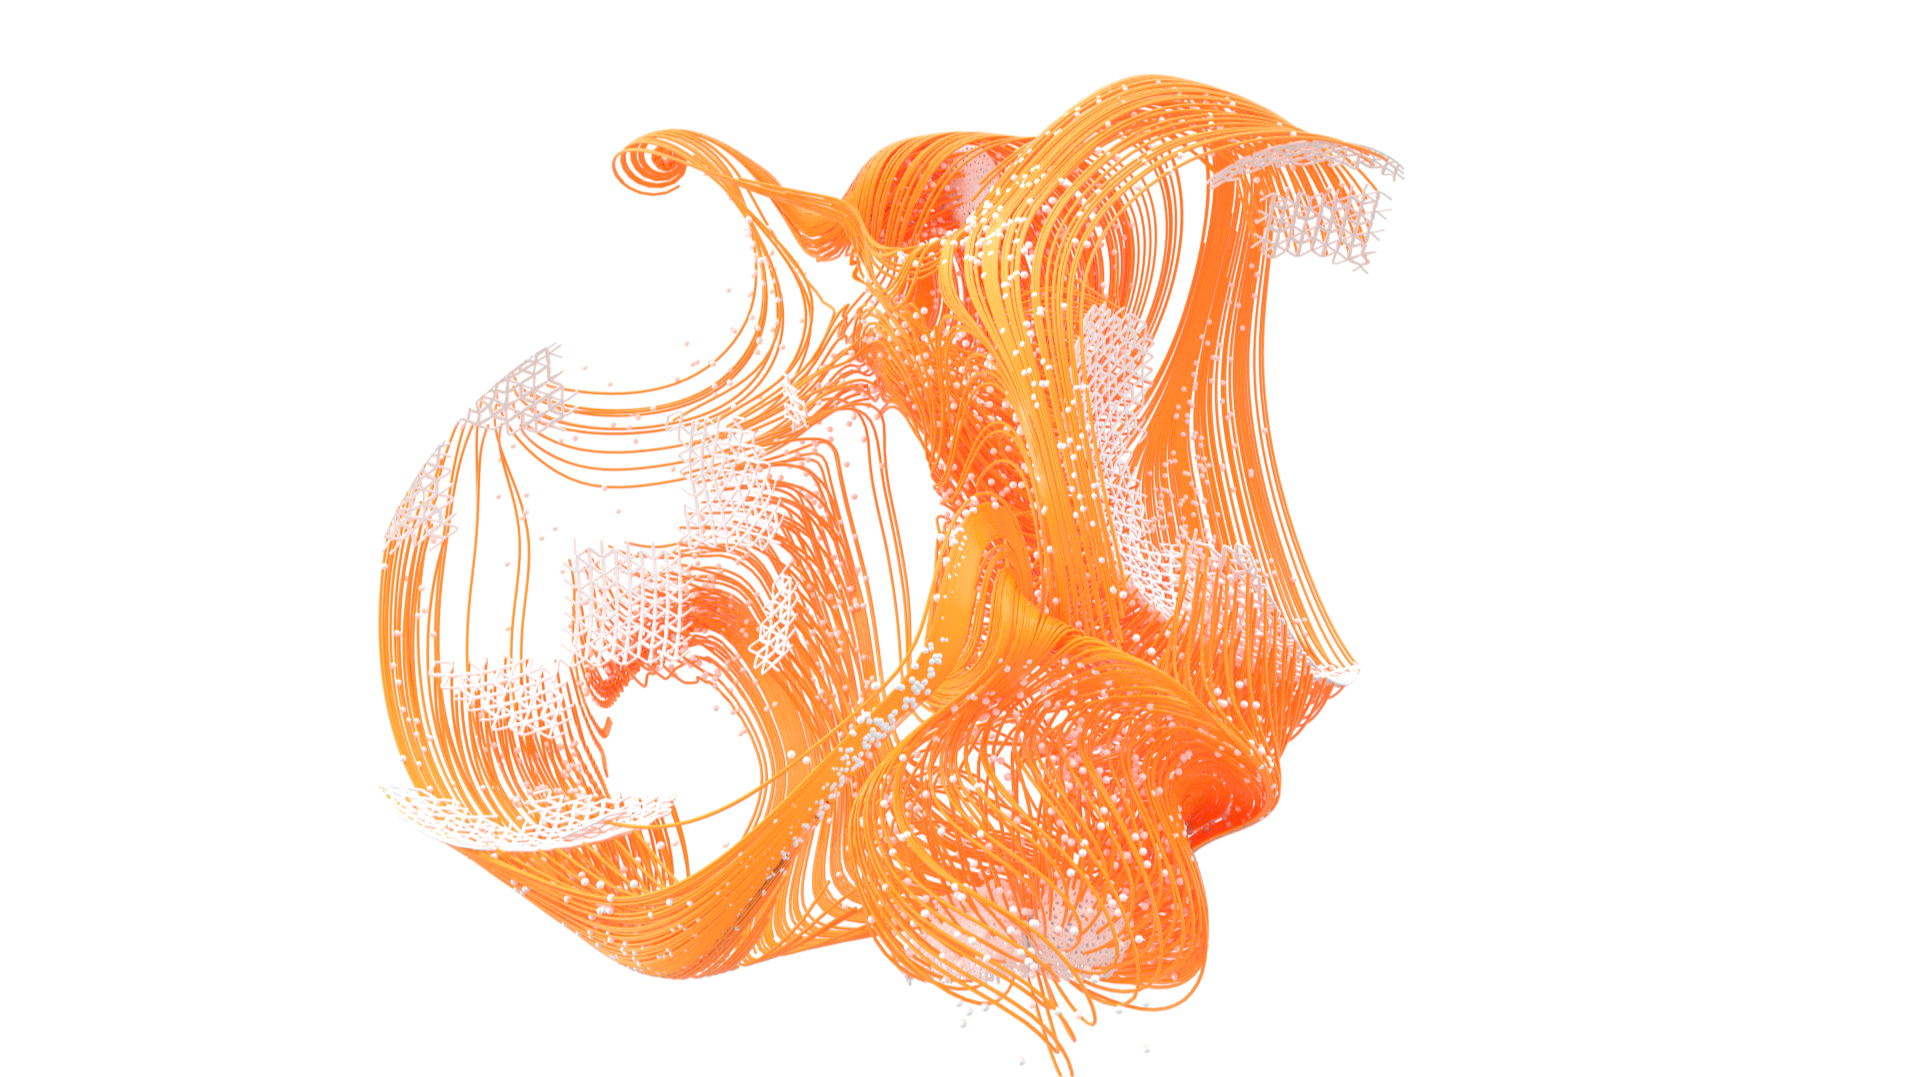
Motion
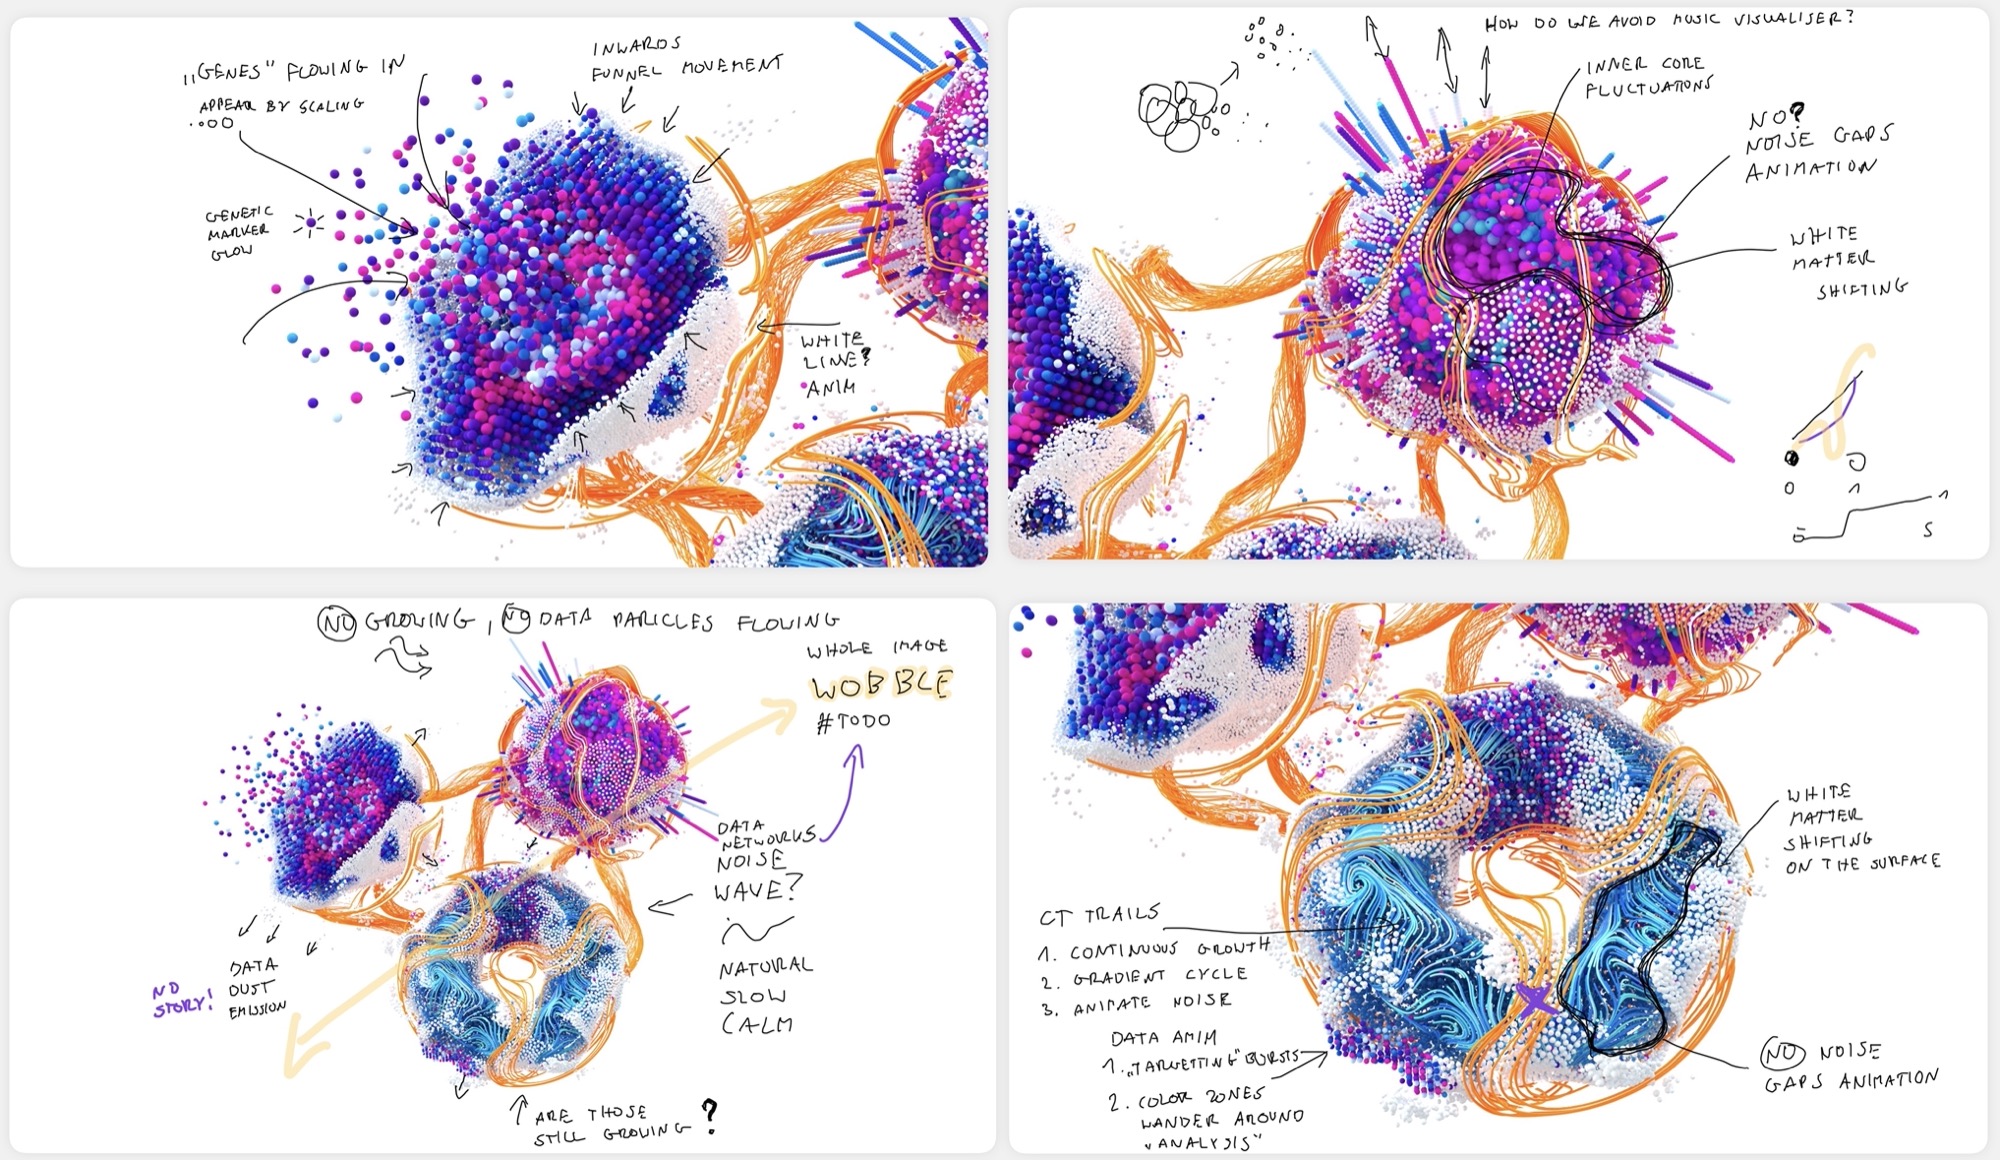
From the beginning we knew we wanted to marry the clean and sterile 'tech' look with elegant organic motion. We hoped to display the juxtaposition of the impersonal big data approach affecting the very personal biological systems of the individual.
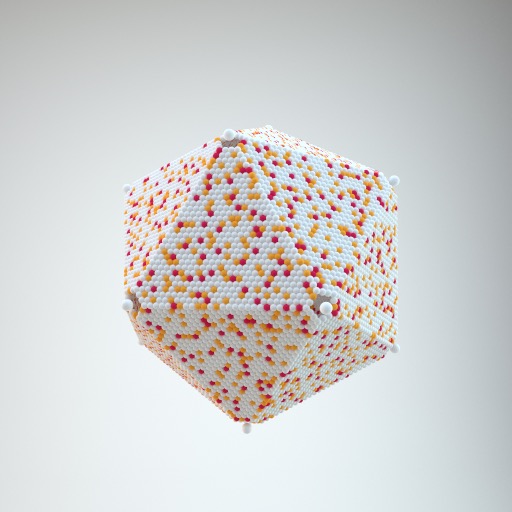
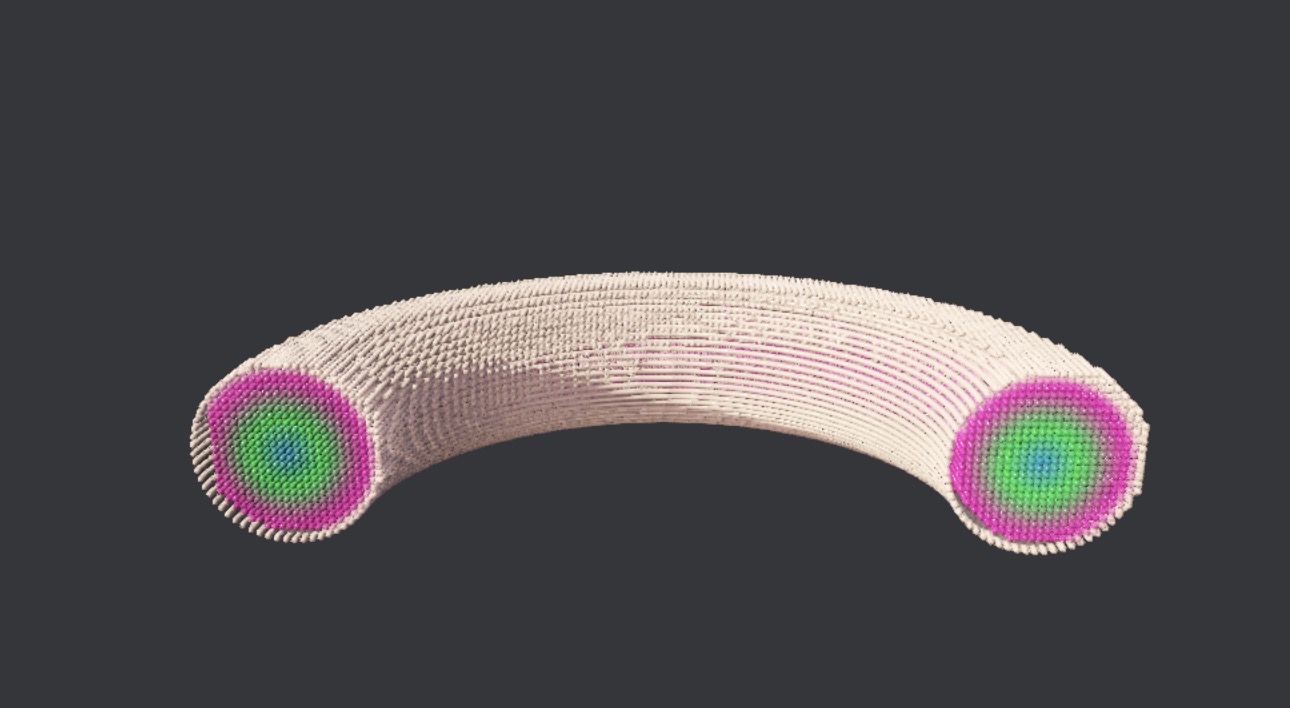
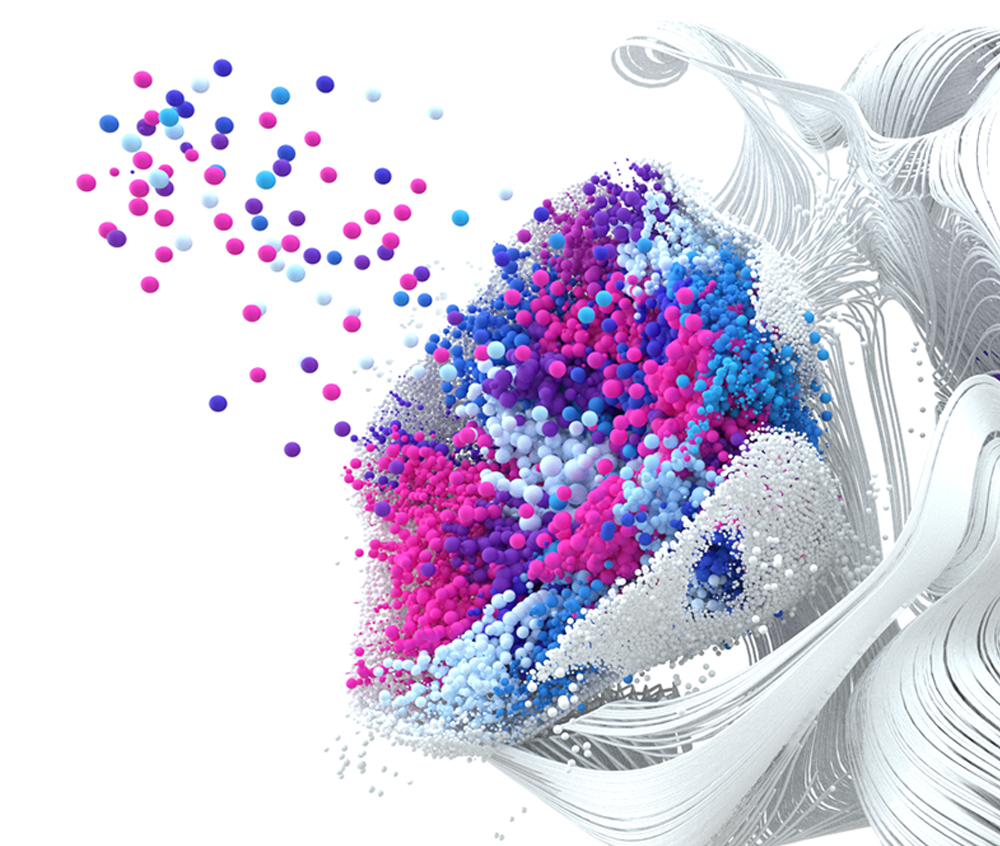
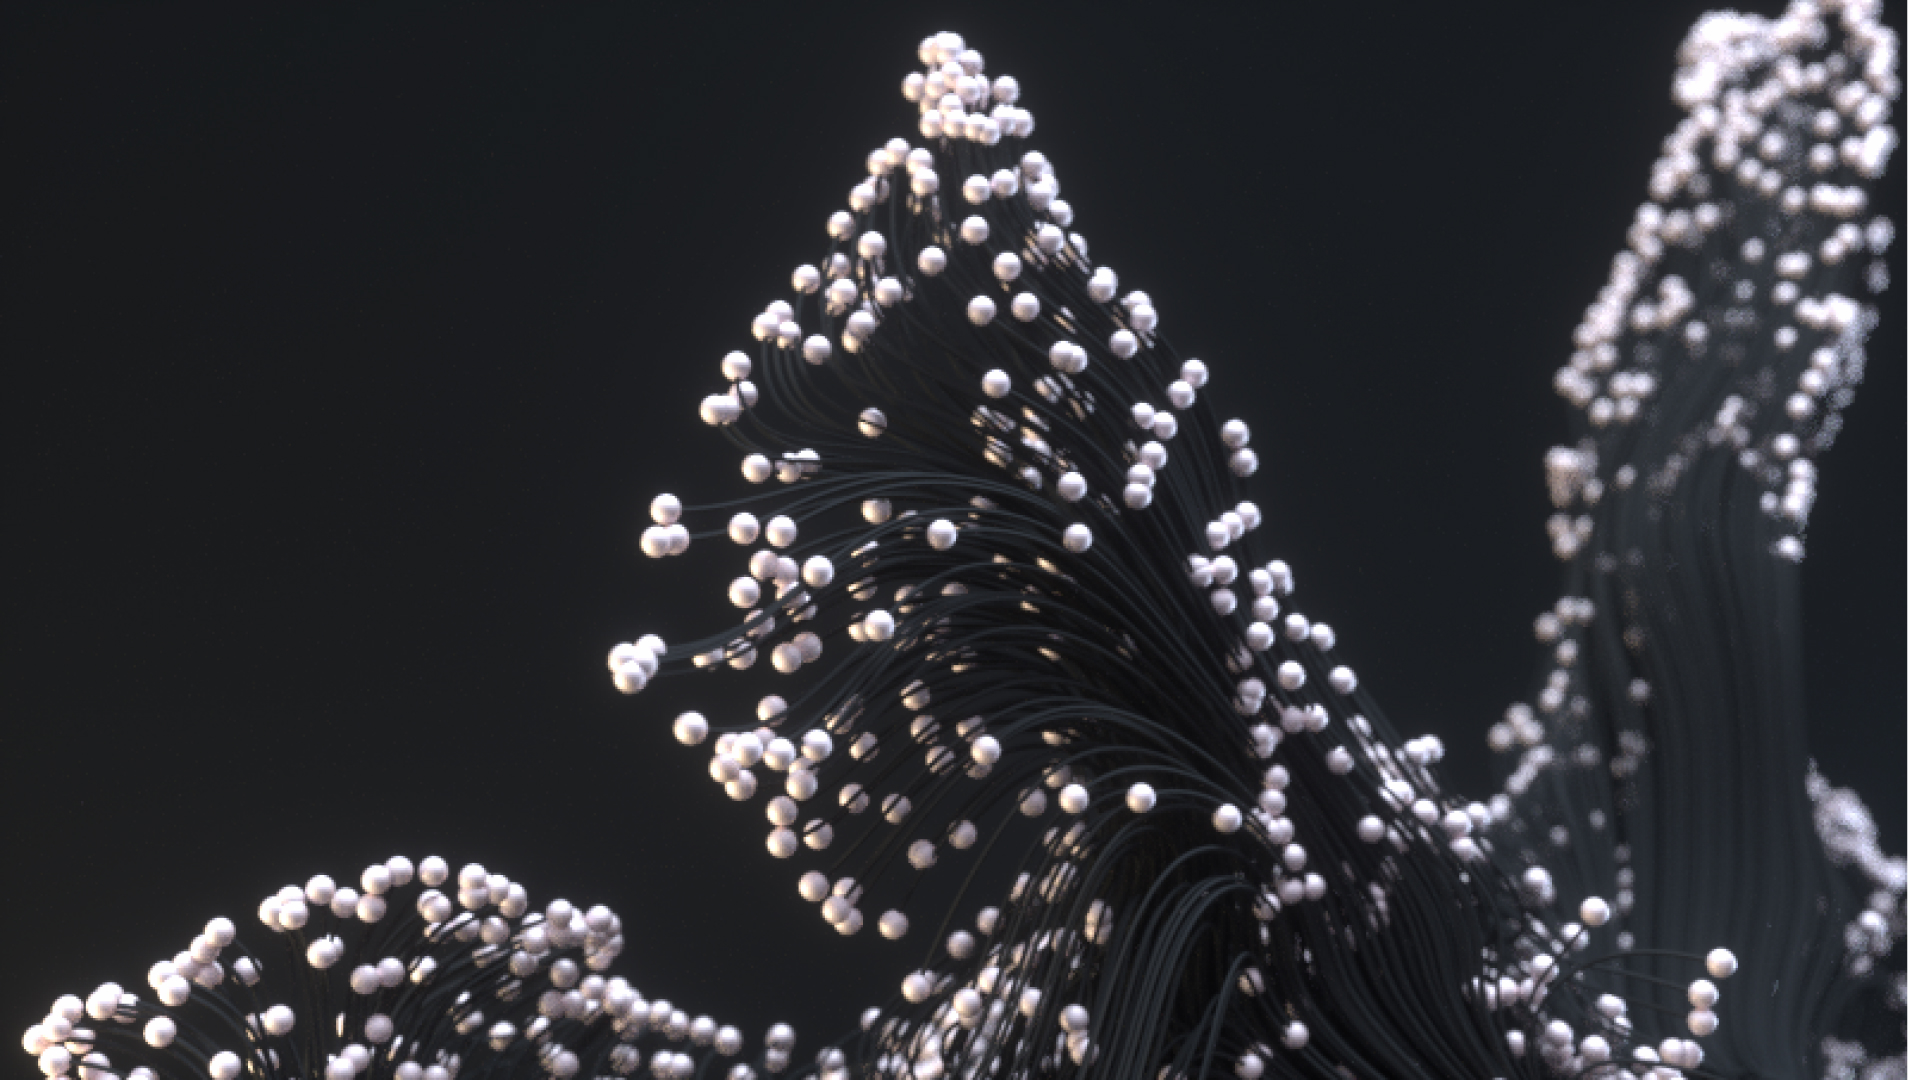
Data looks
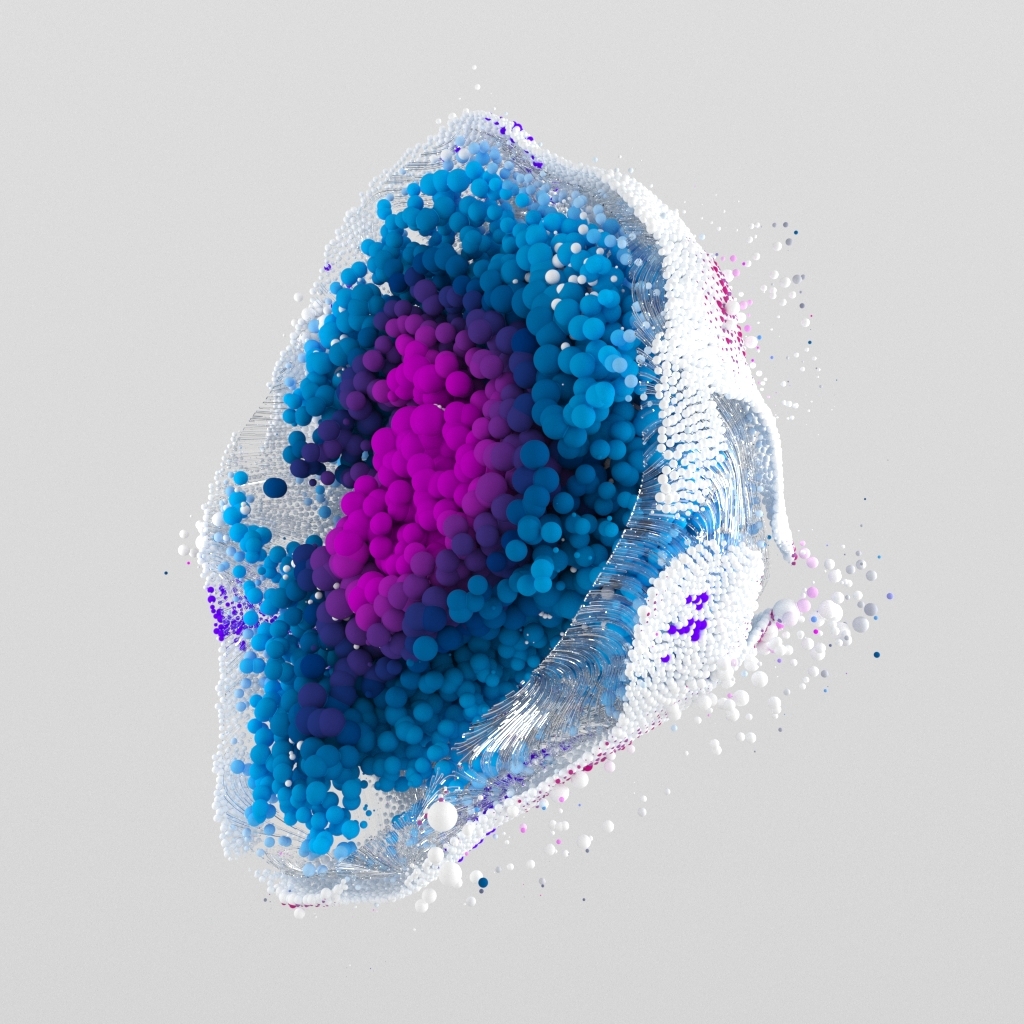
Much of what we were displaying was big data that needed representation. We explored a few avenues for this, evntually taking inspiration from genes and their classical depictions of discerete spheres of simple color.
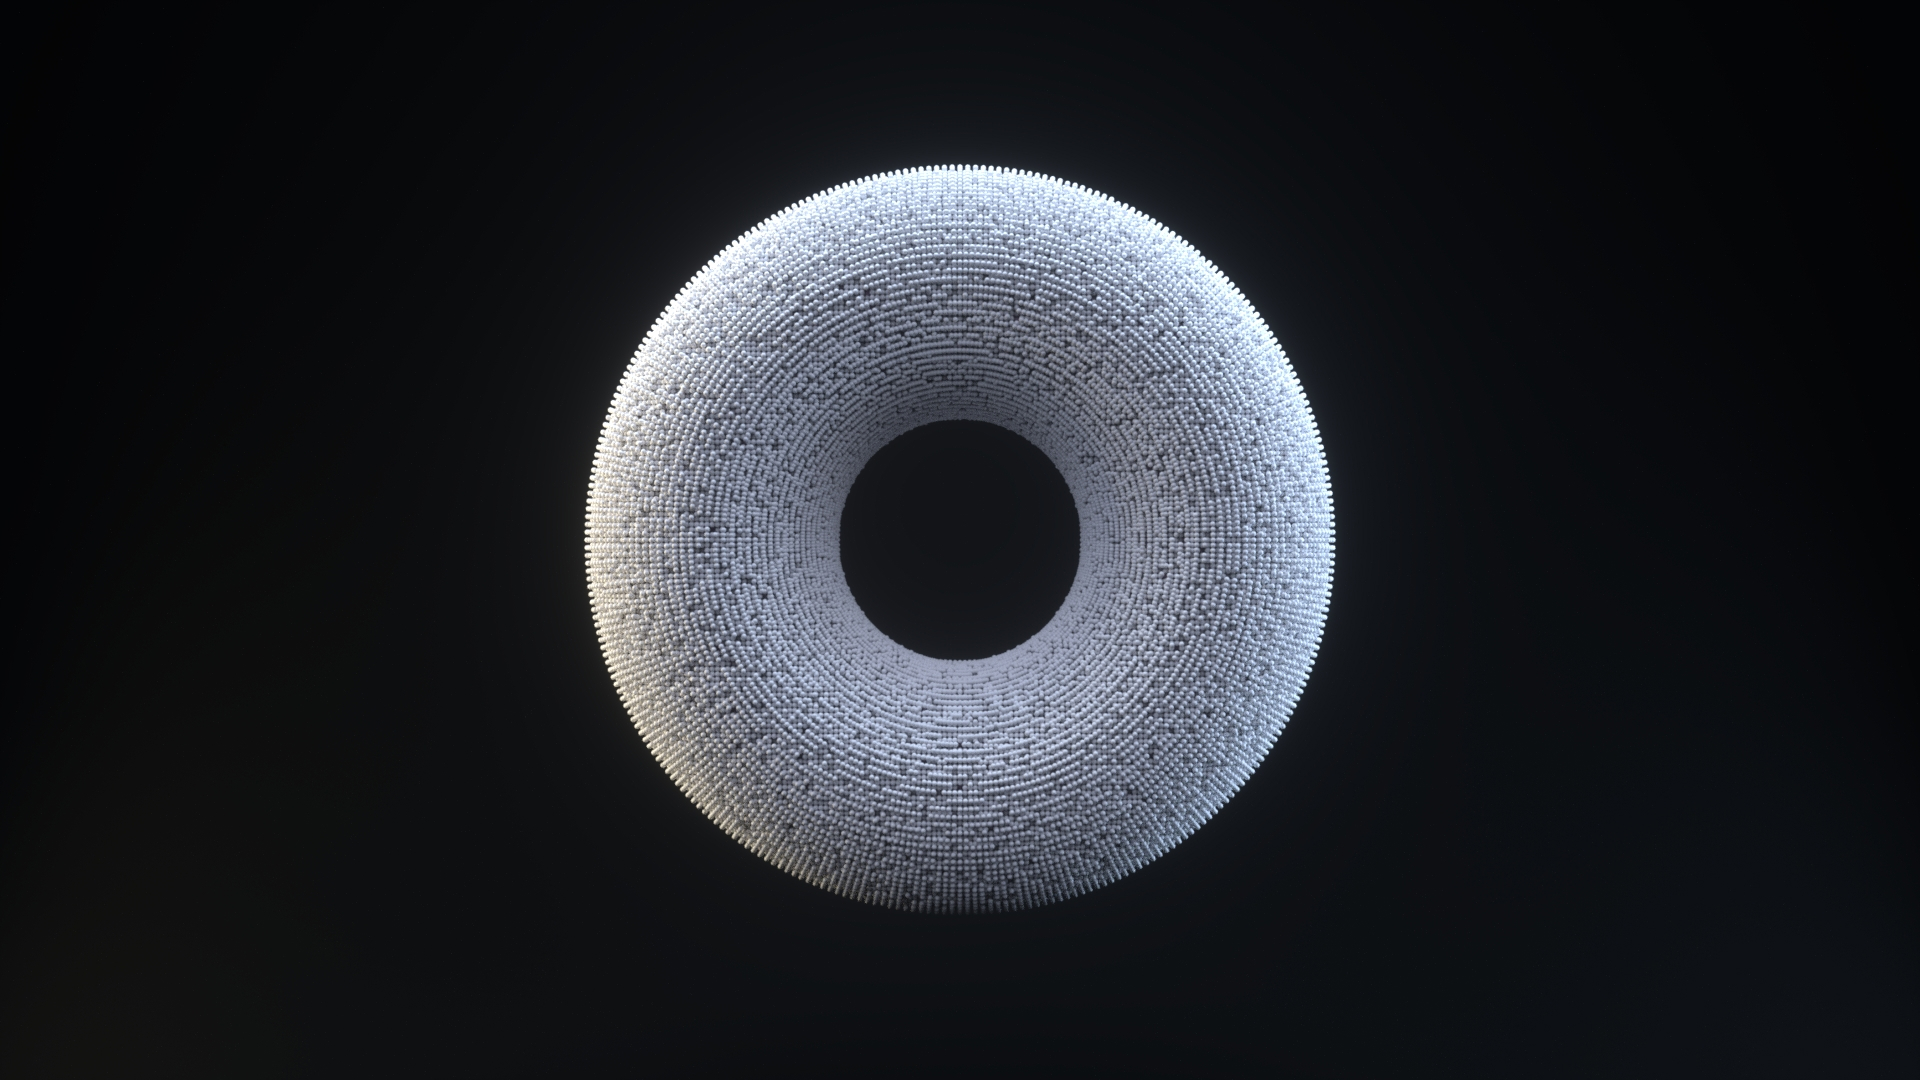
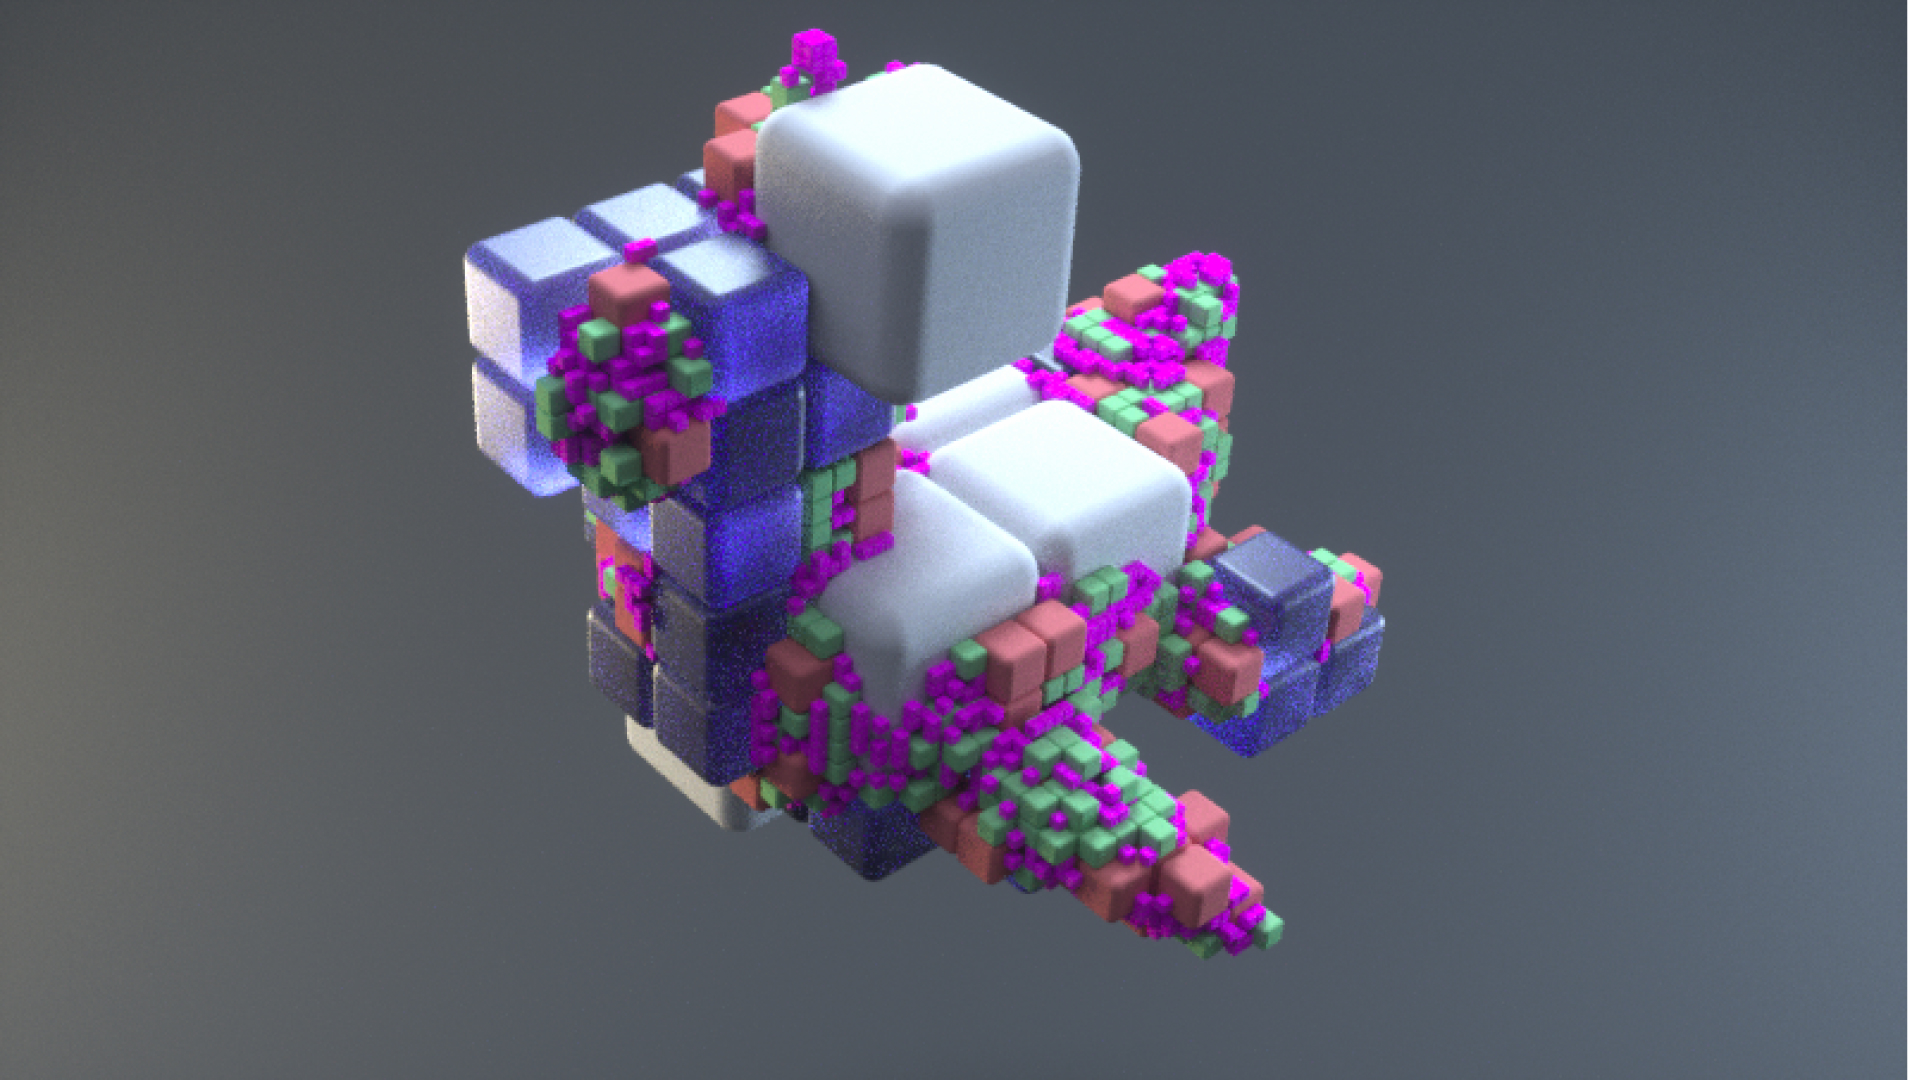
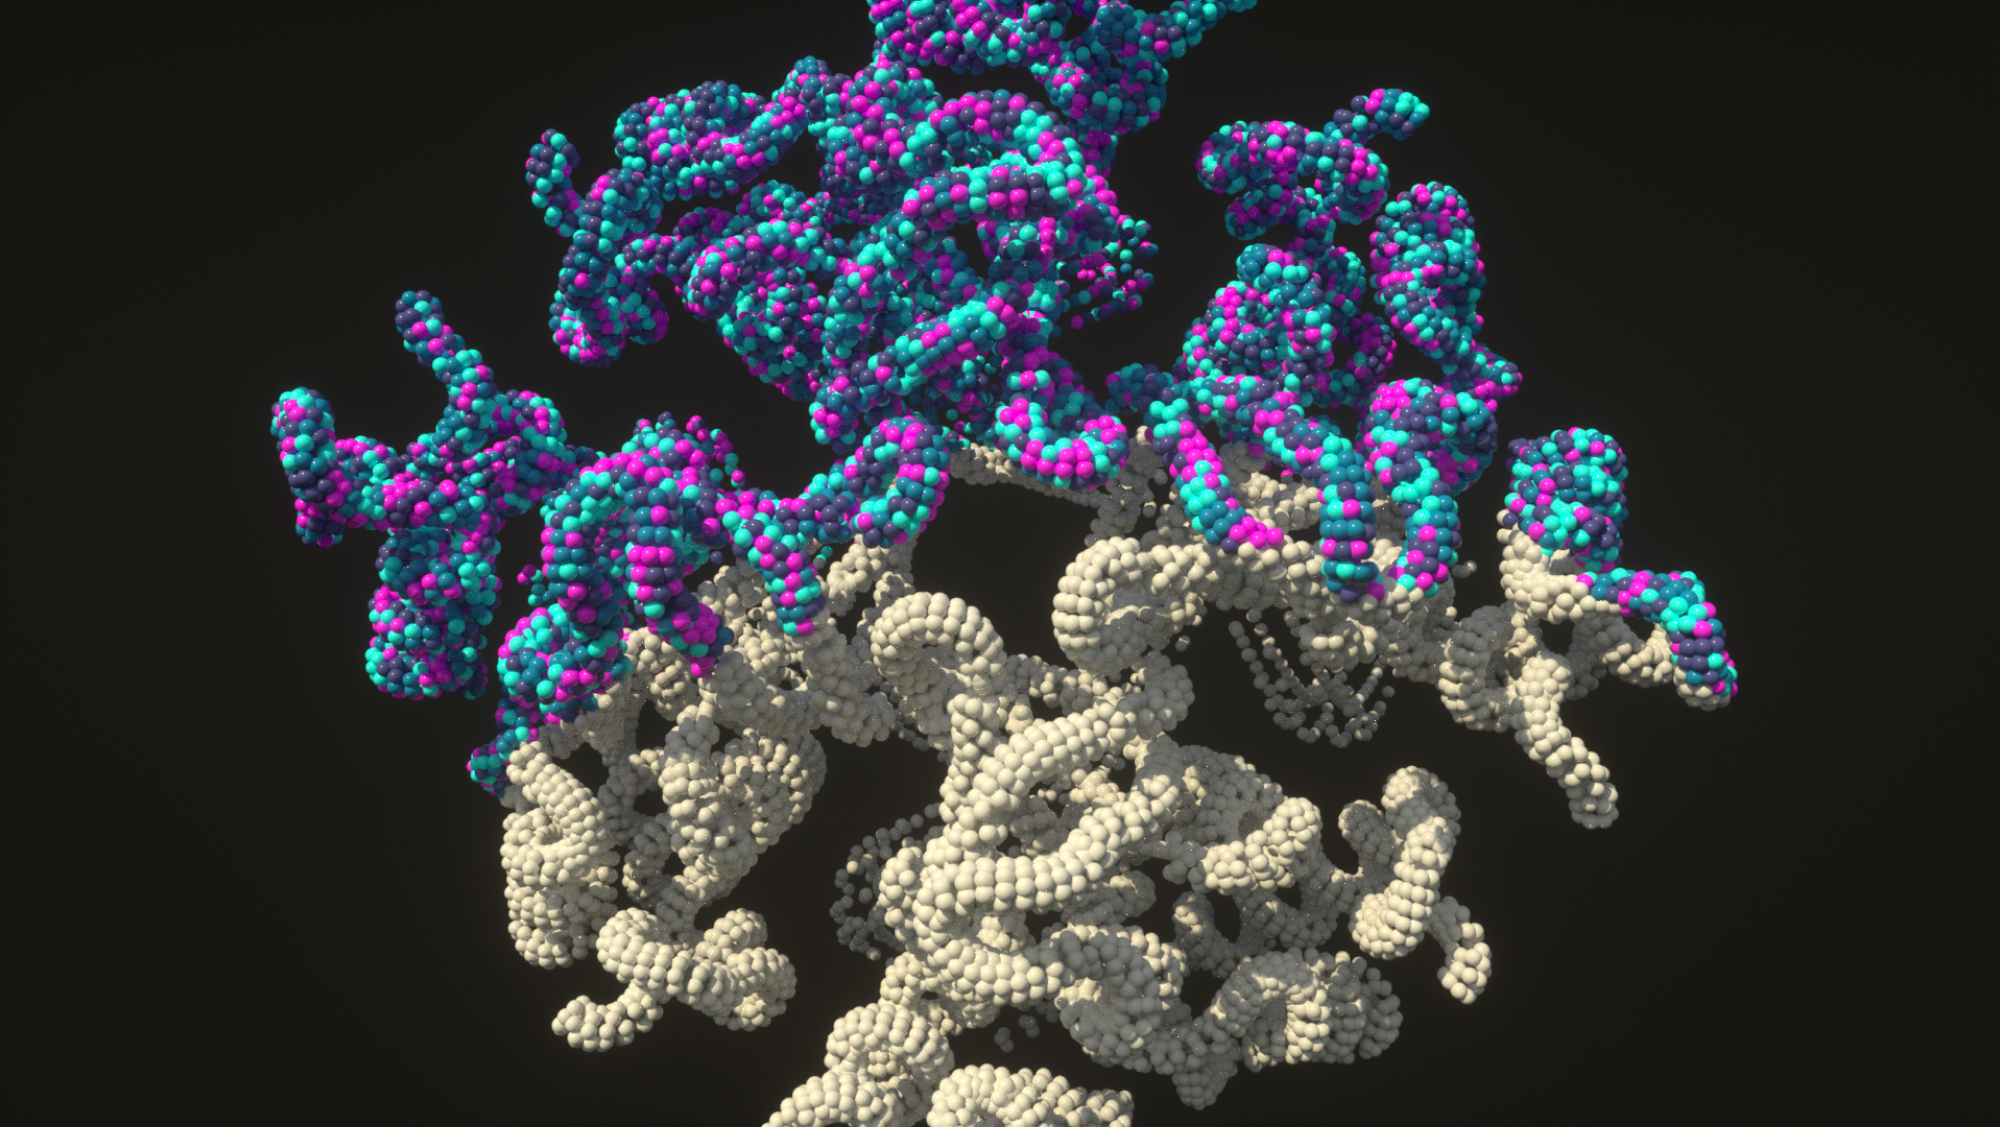
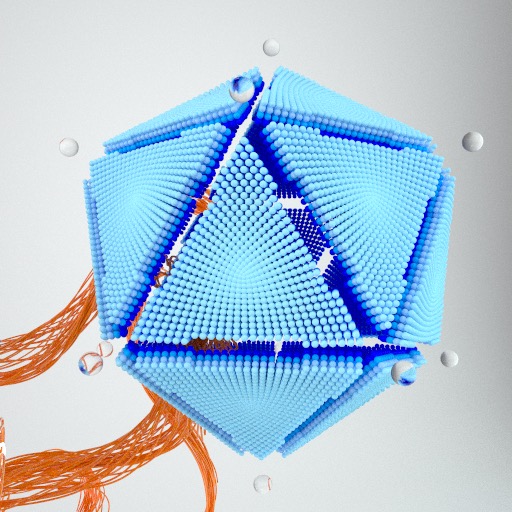
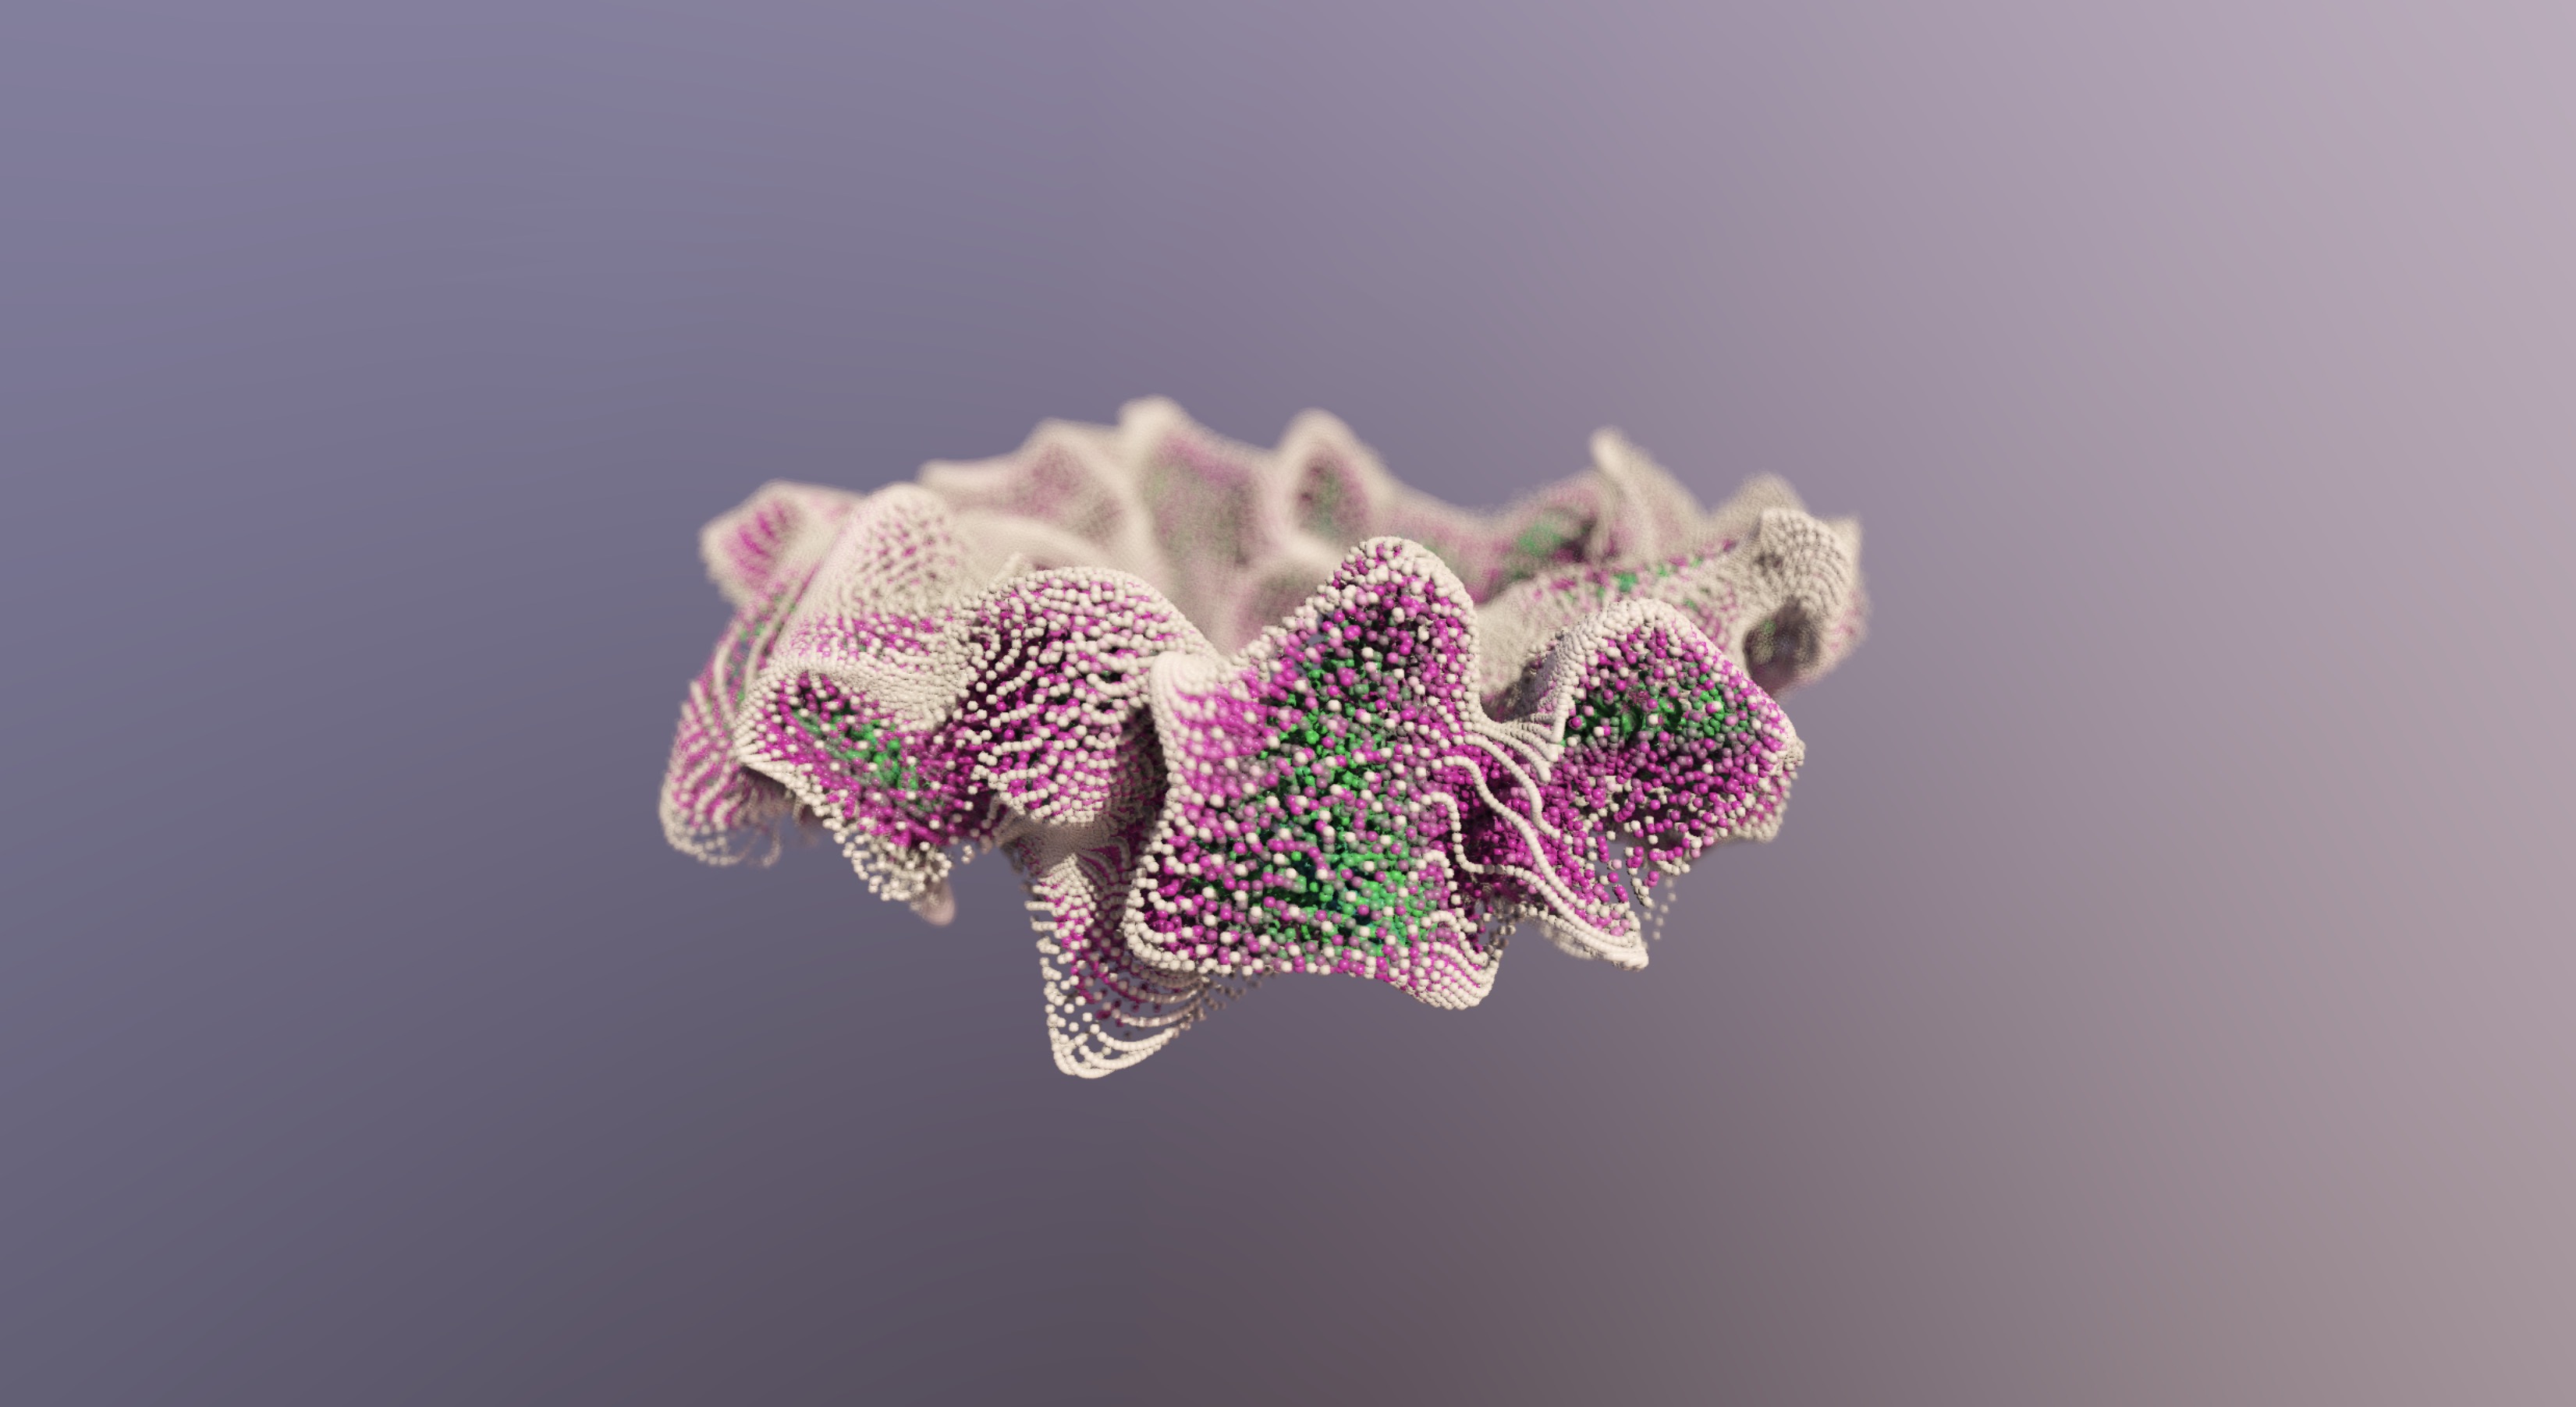
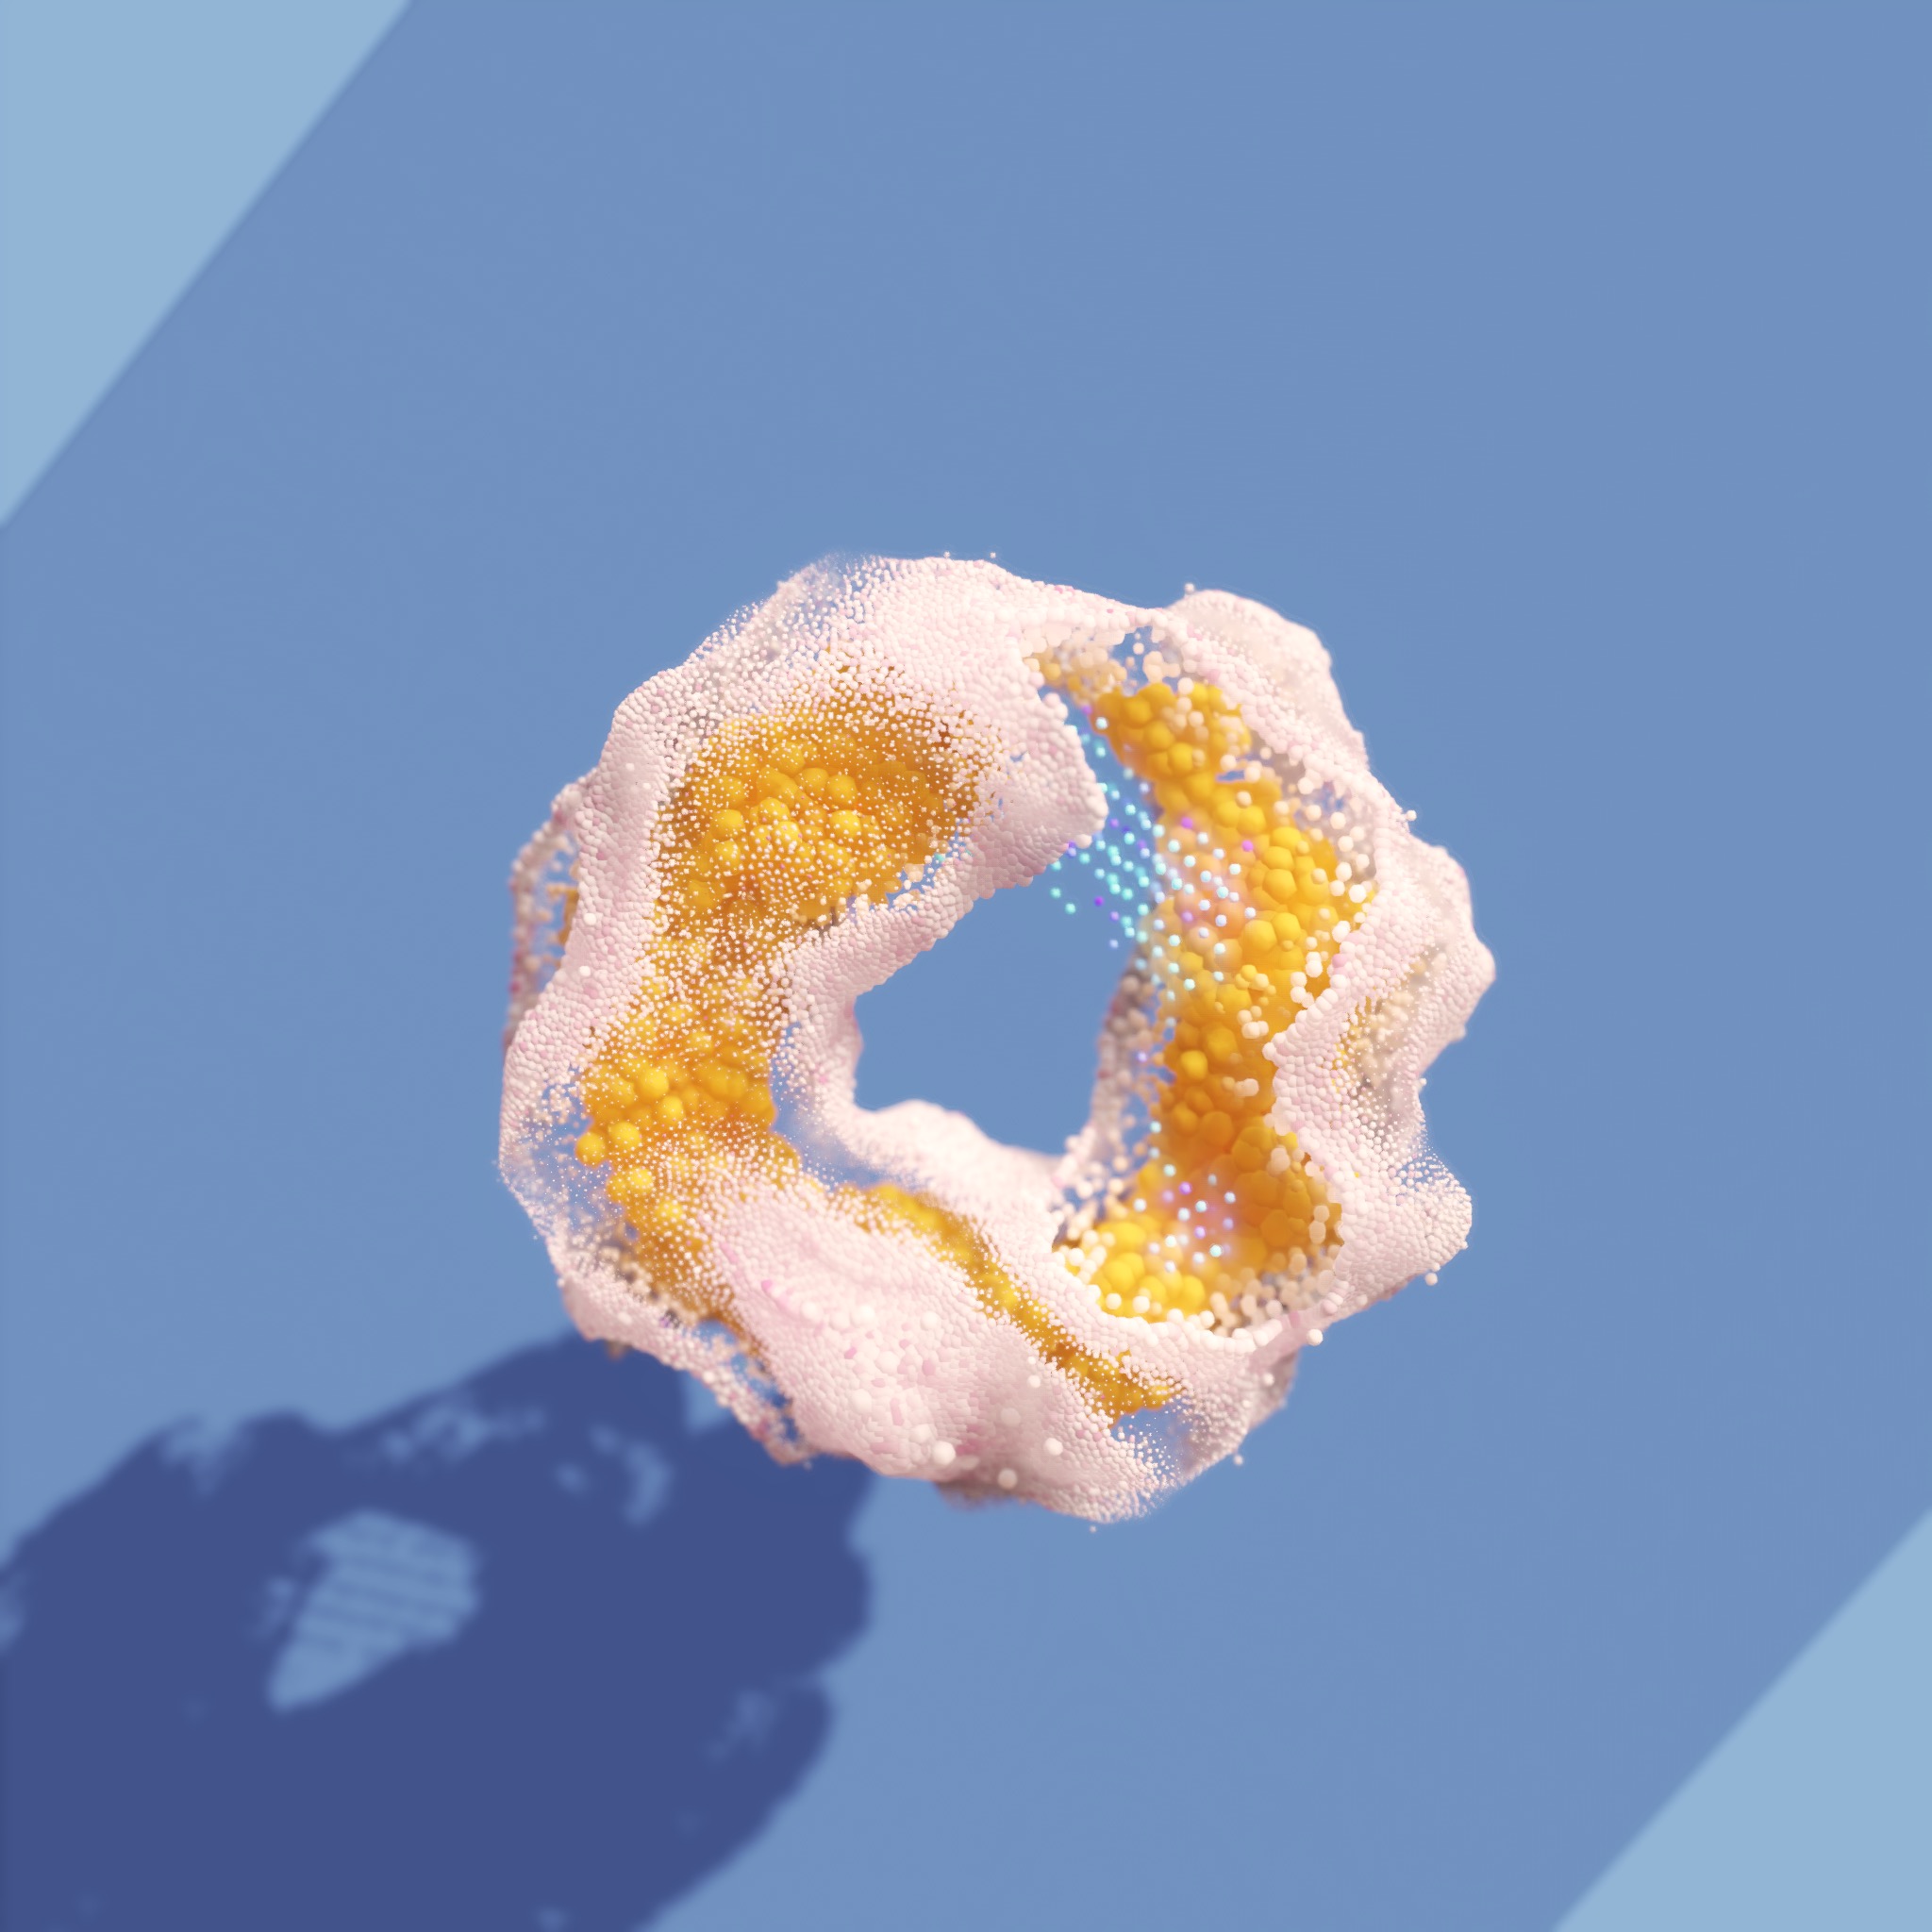
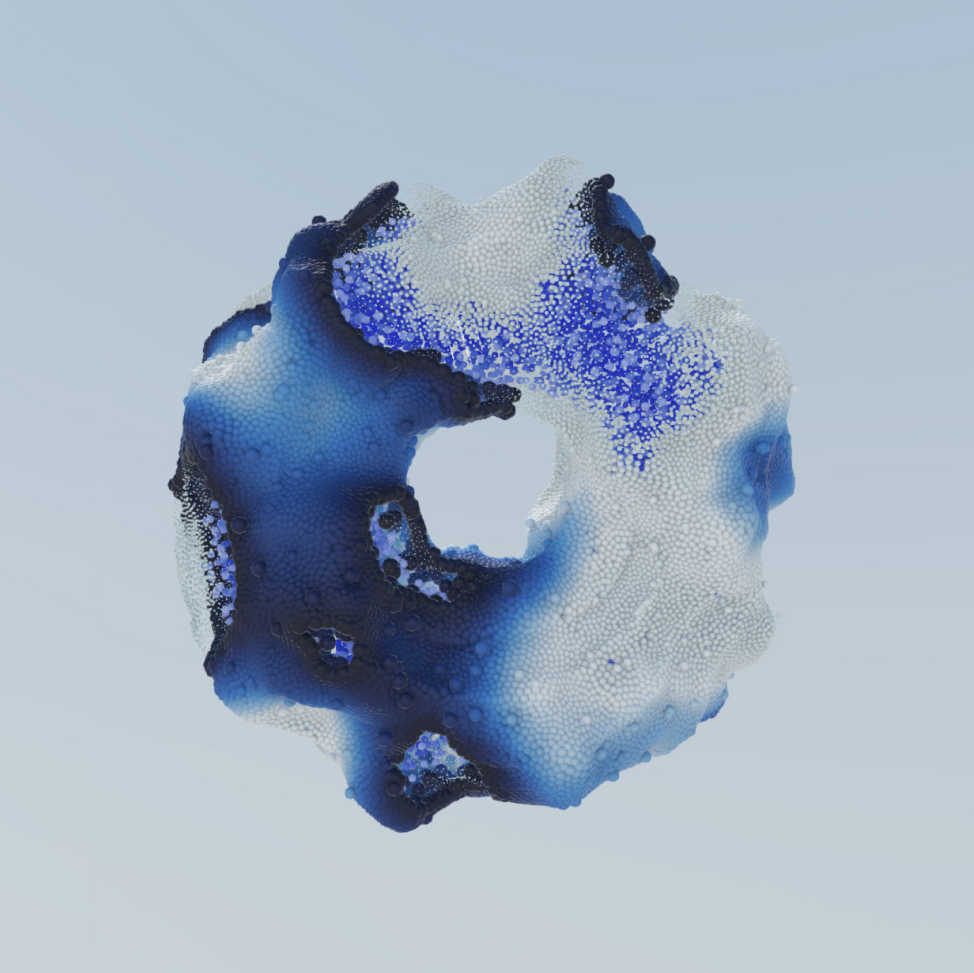
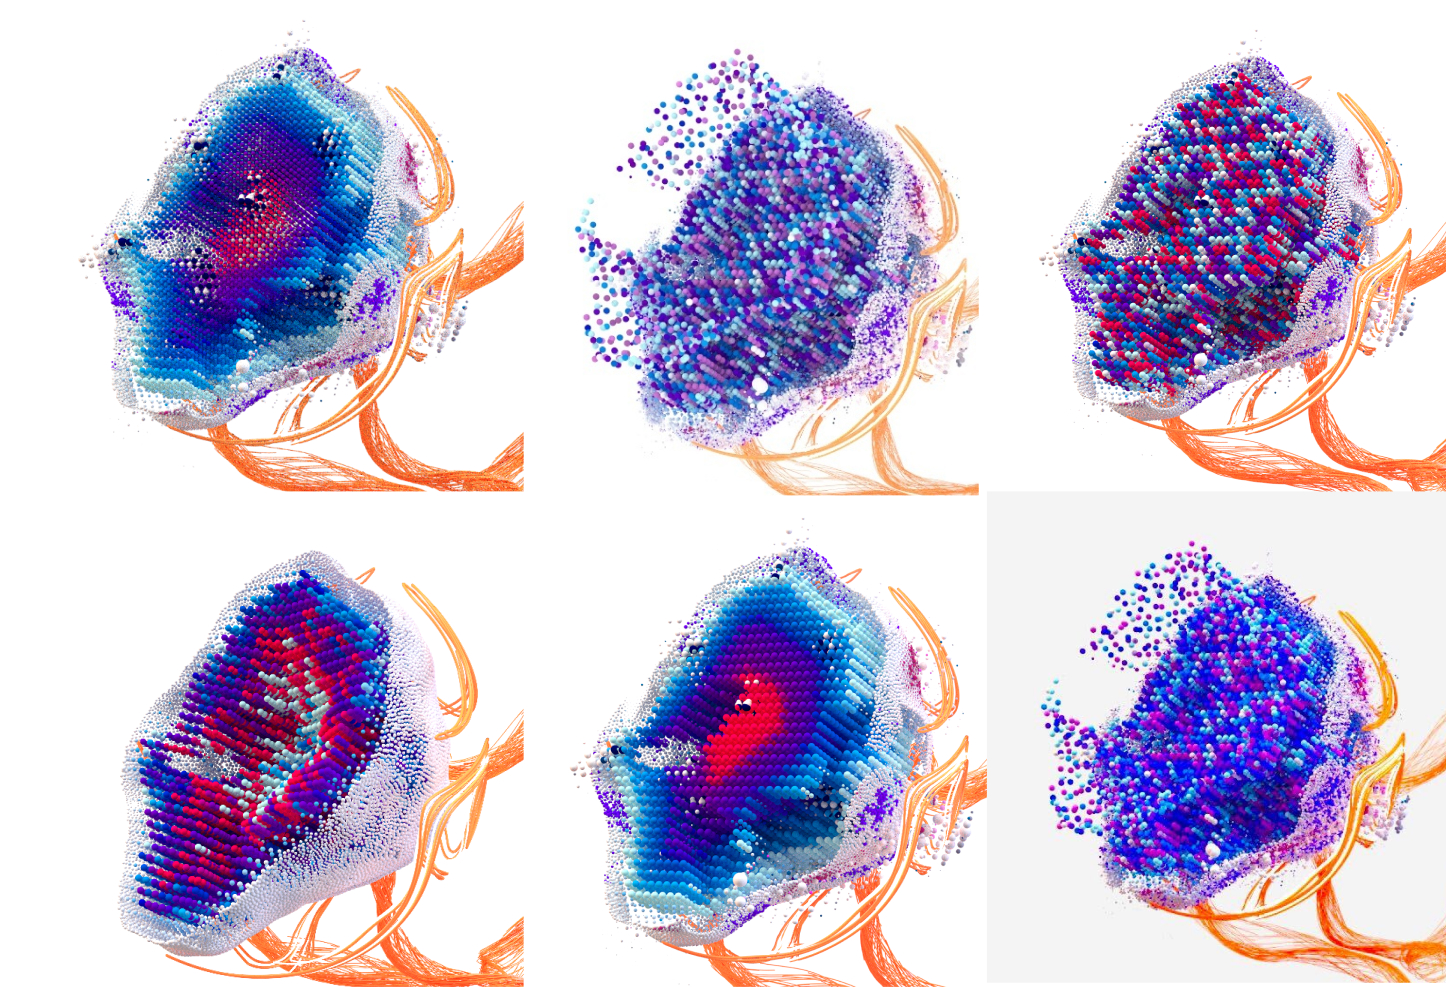
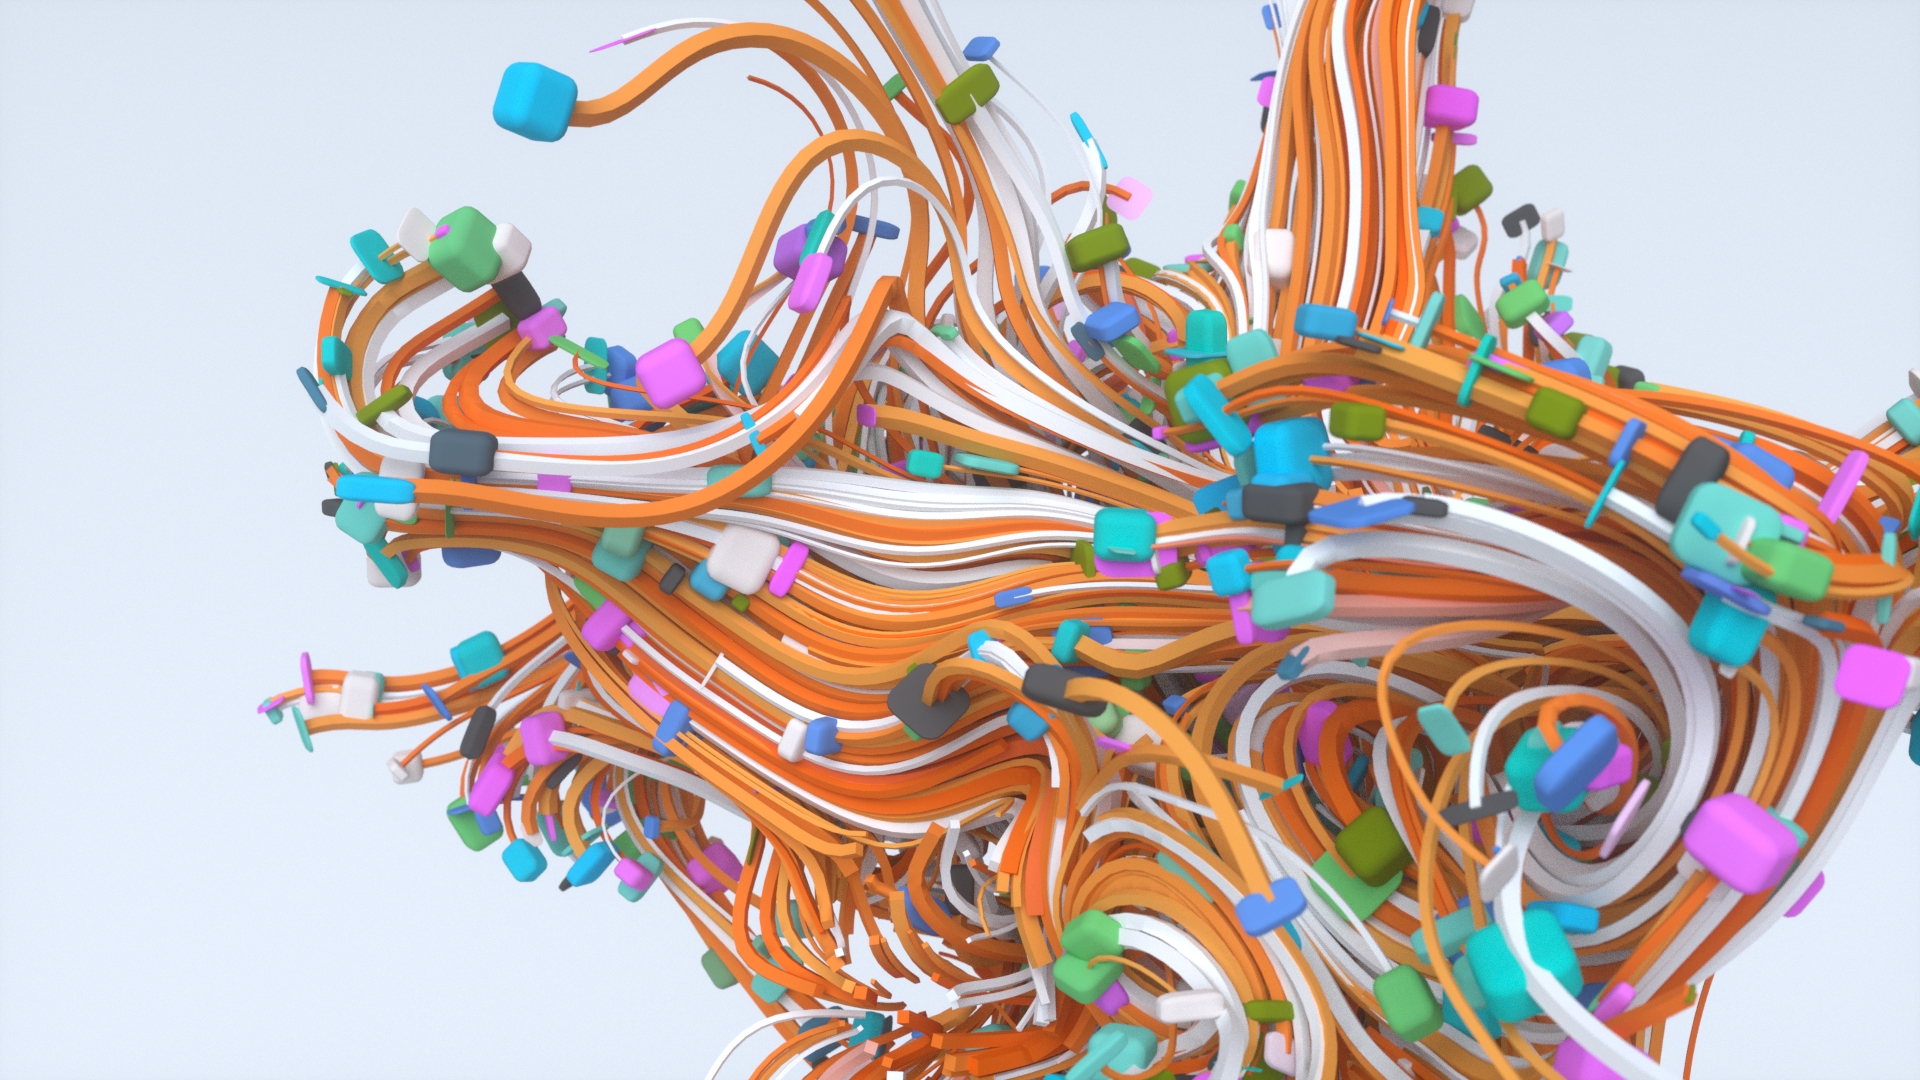
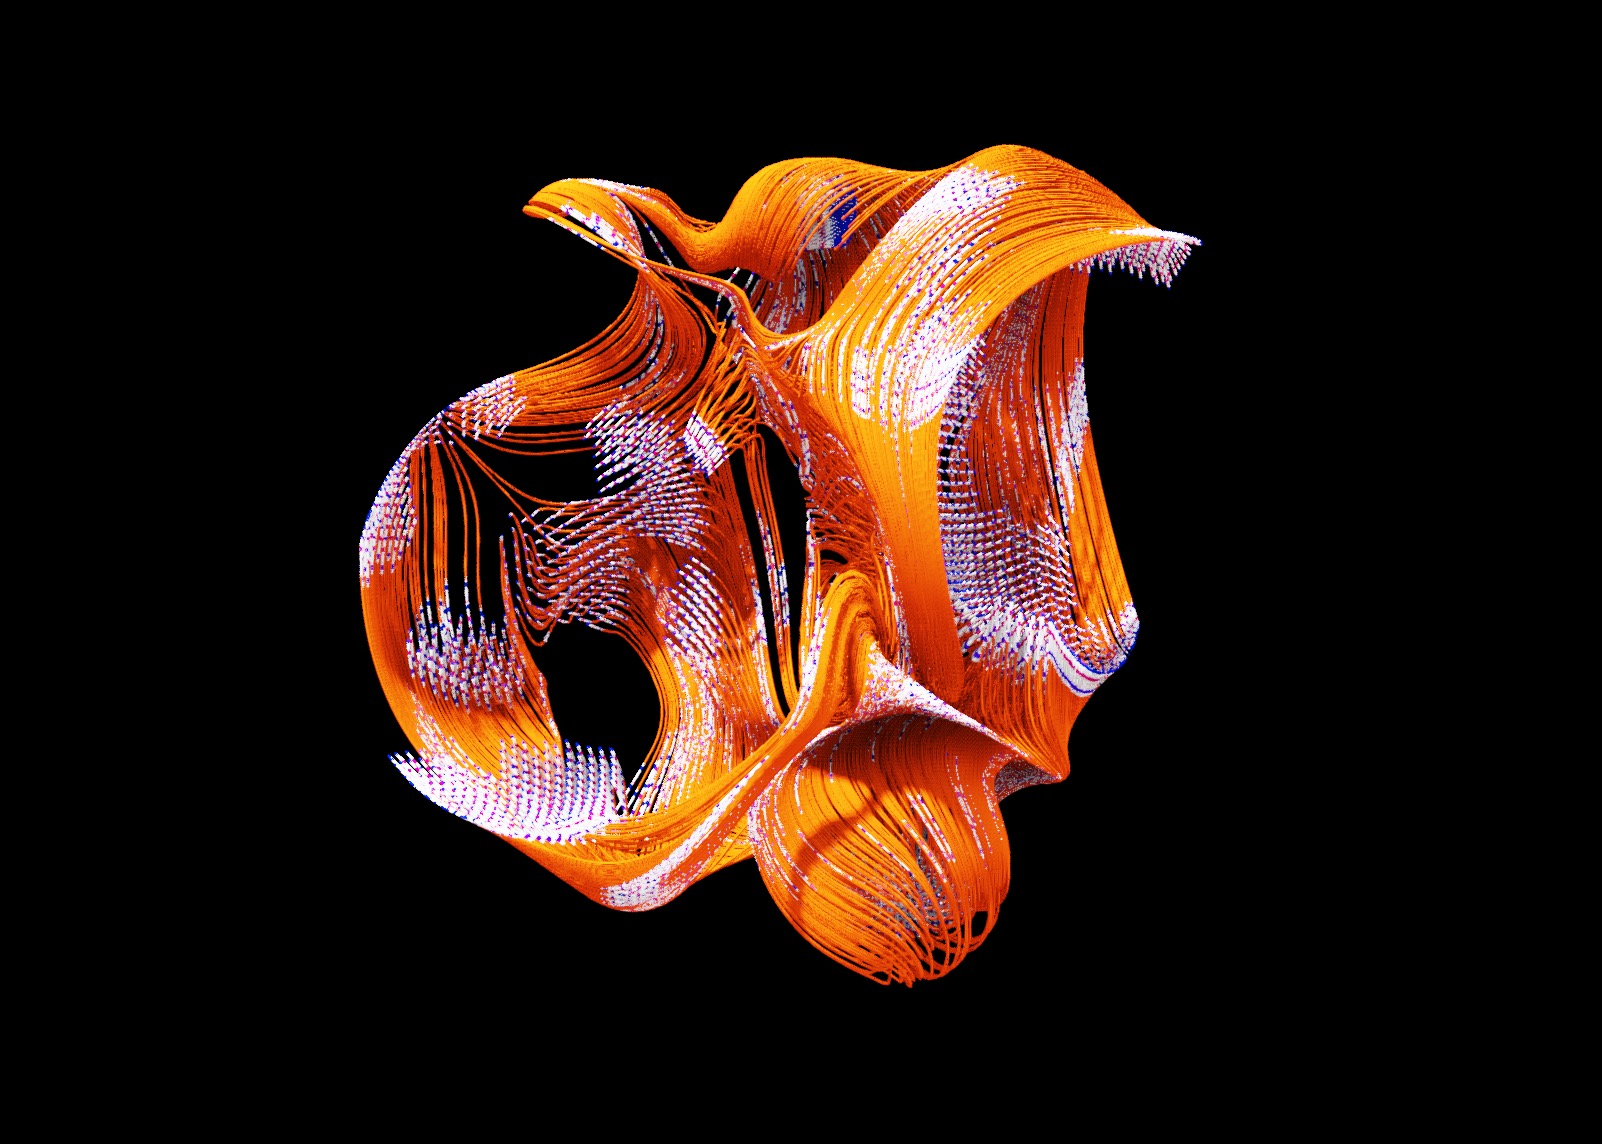
Layers and noise
It was from the development of the 'data look' that the idea of layering was developed. Imagining what the processing of the big data might look like, and continuing to integrate organic inspiration, we designed the layered structures of an 'algorythmic surface' acting upon a data core.
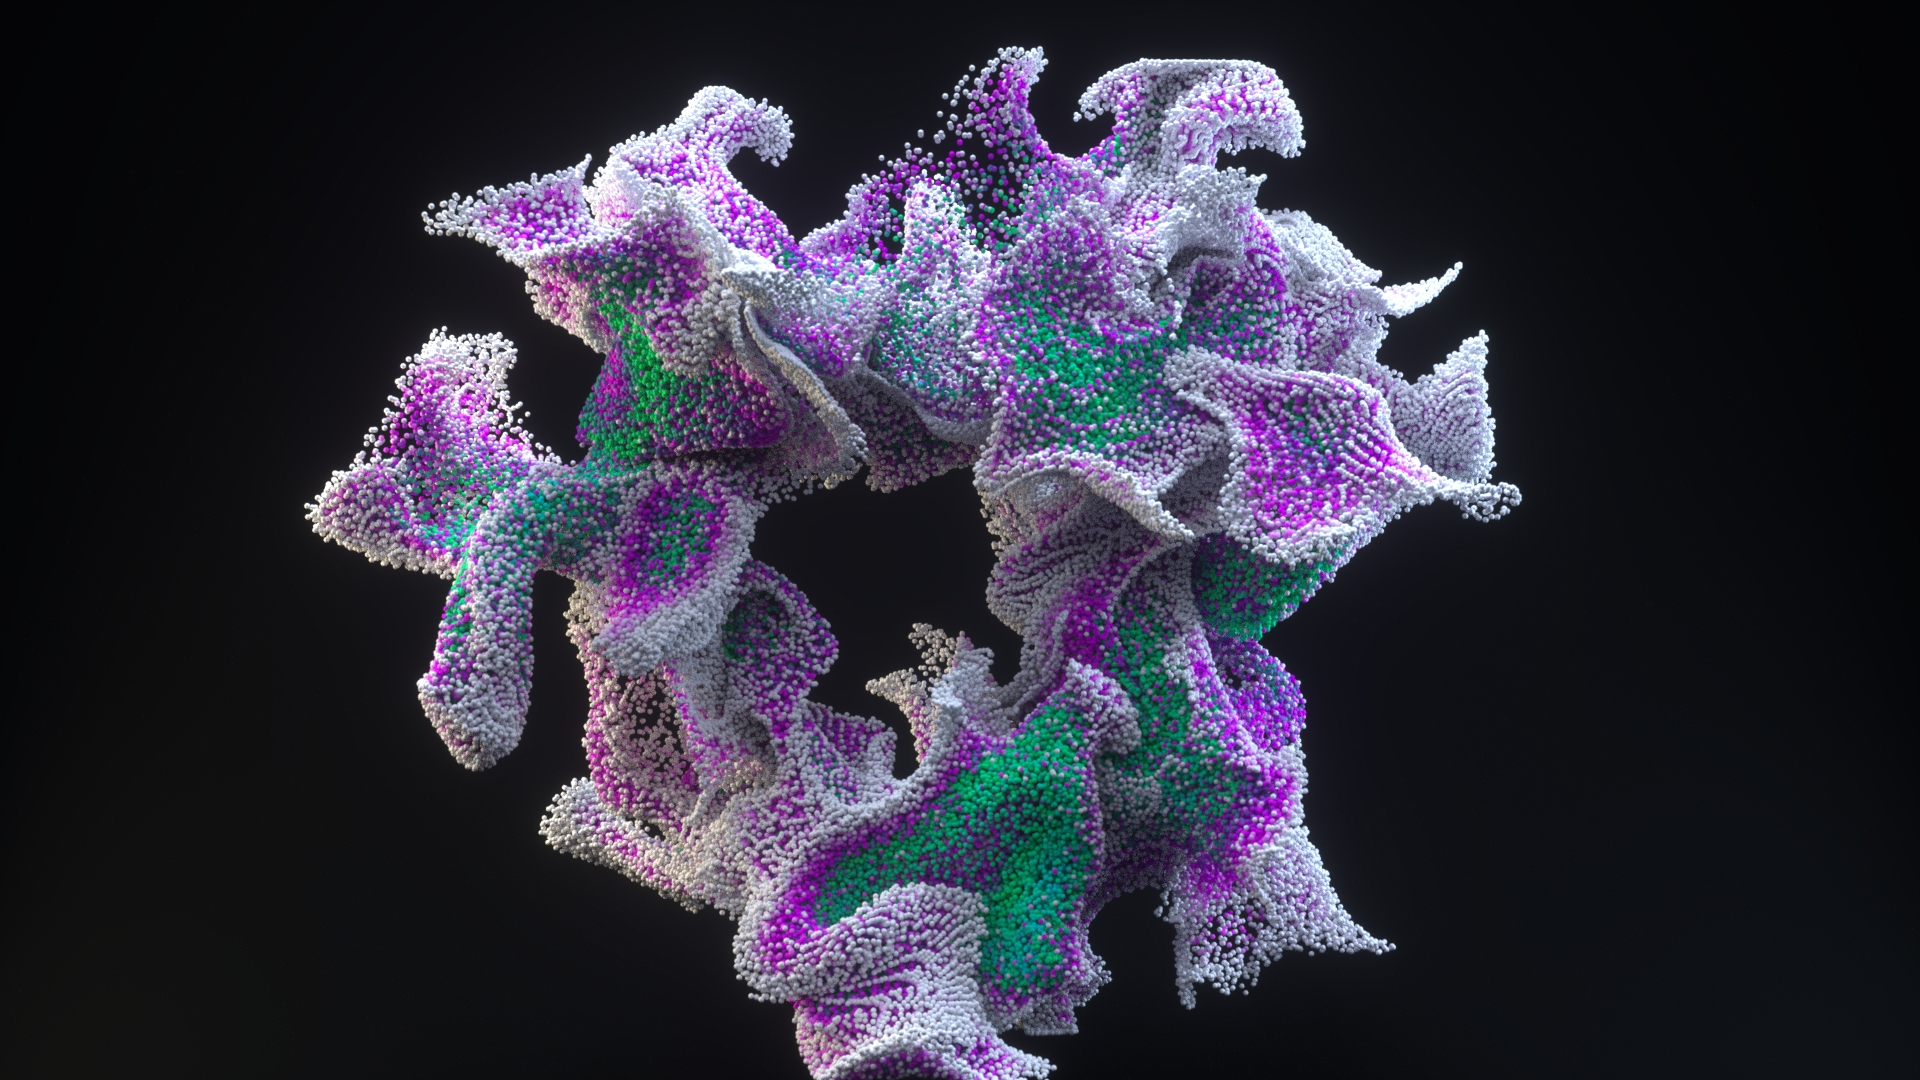
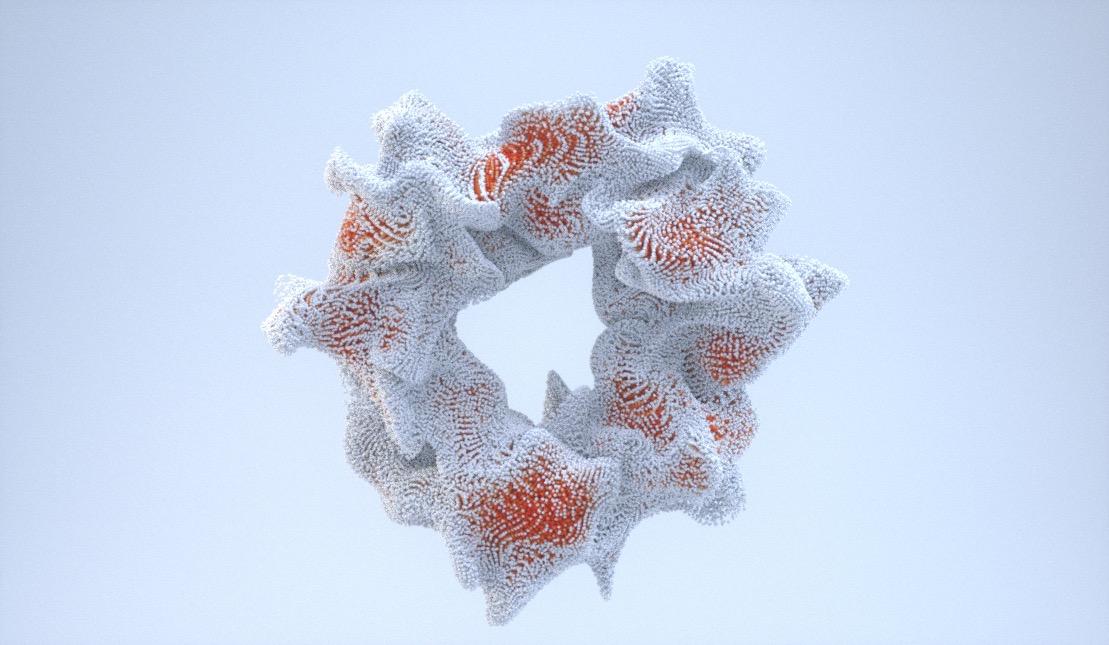
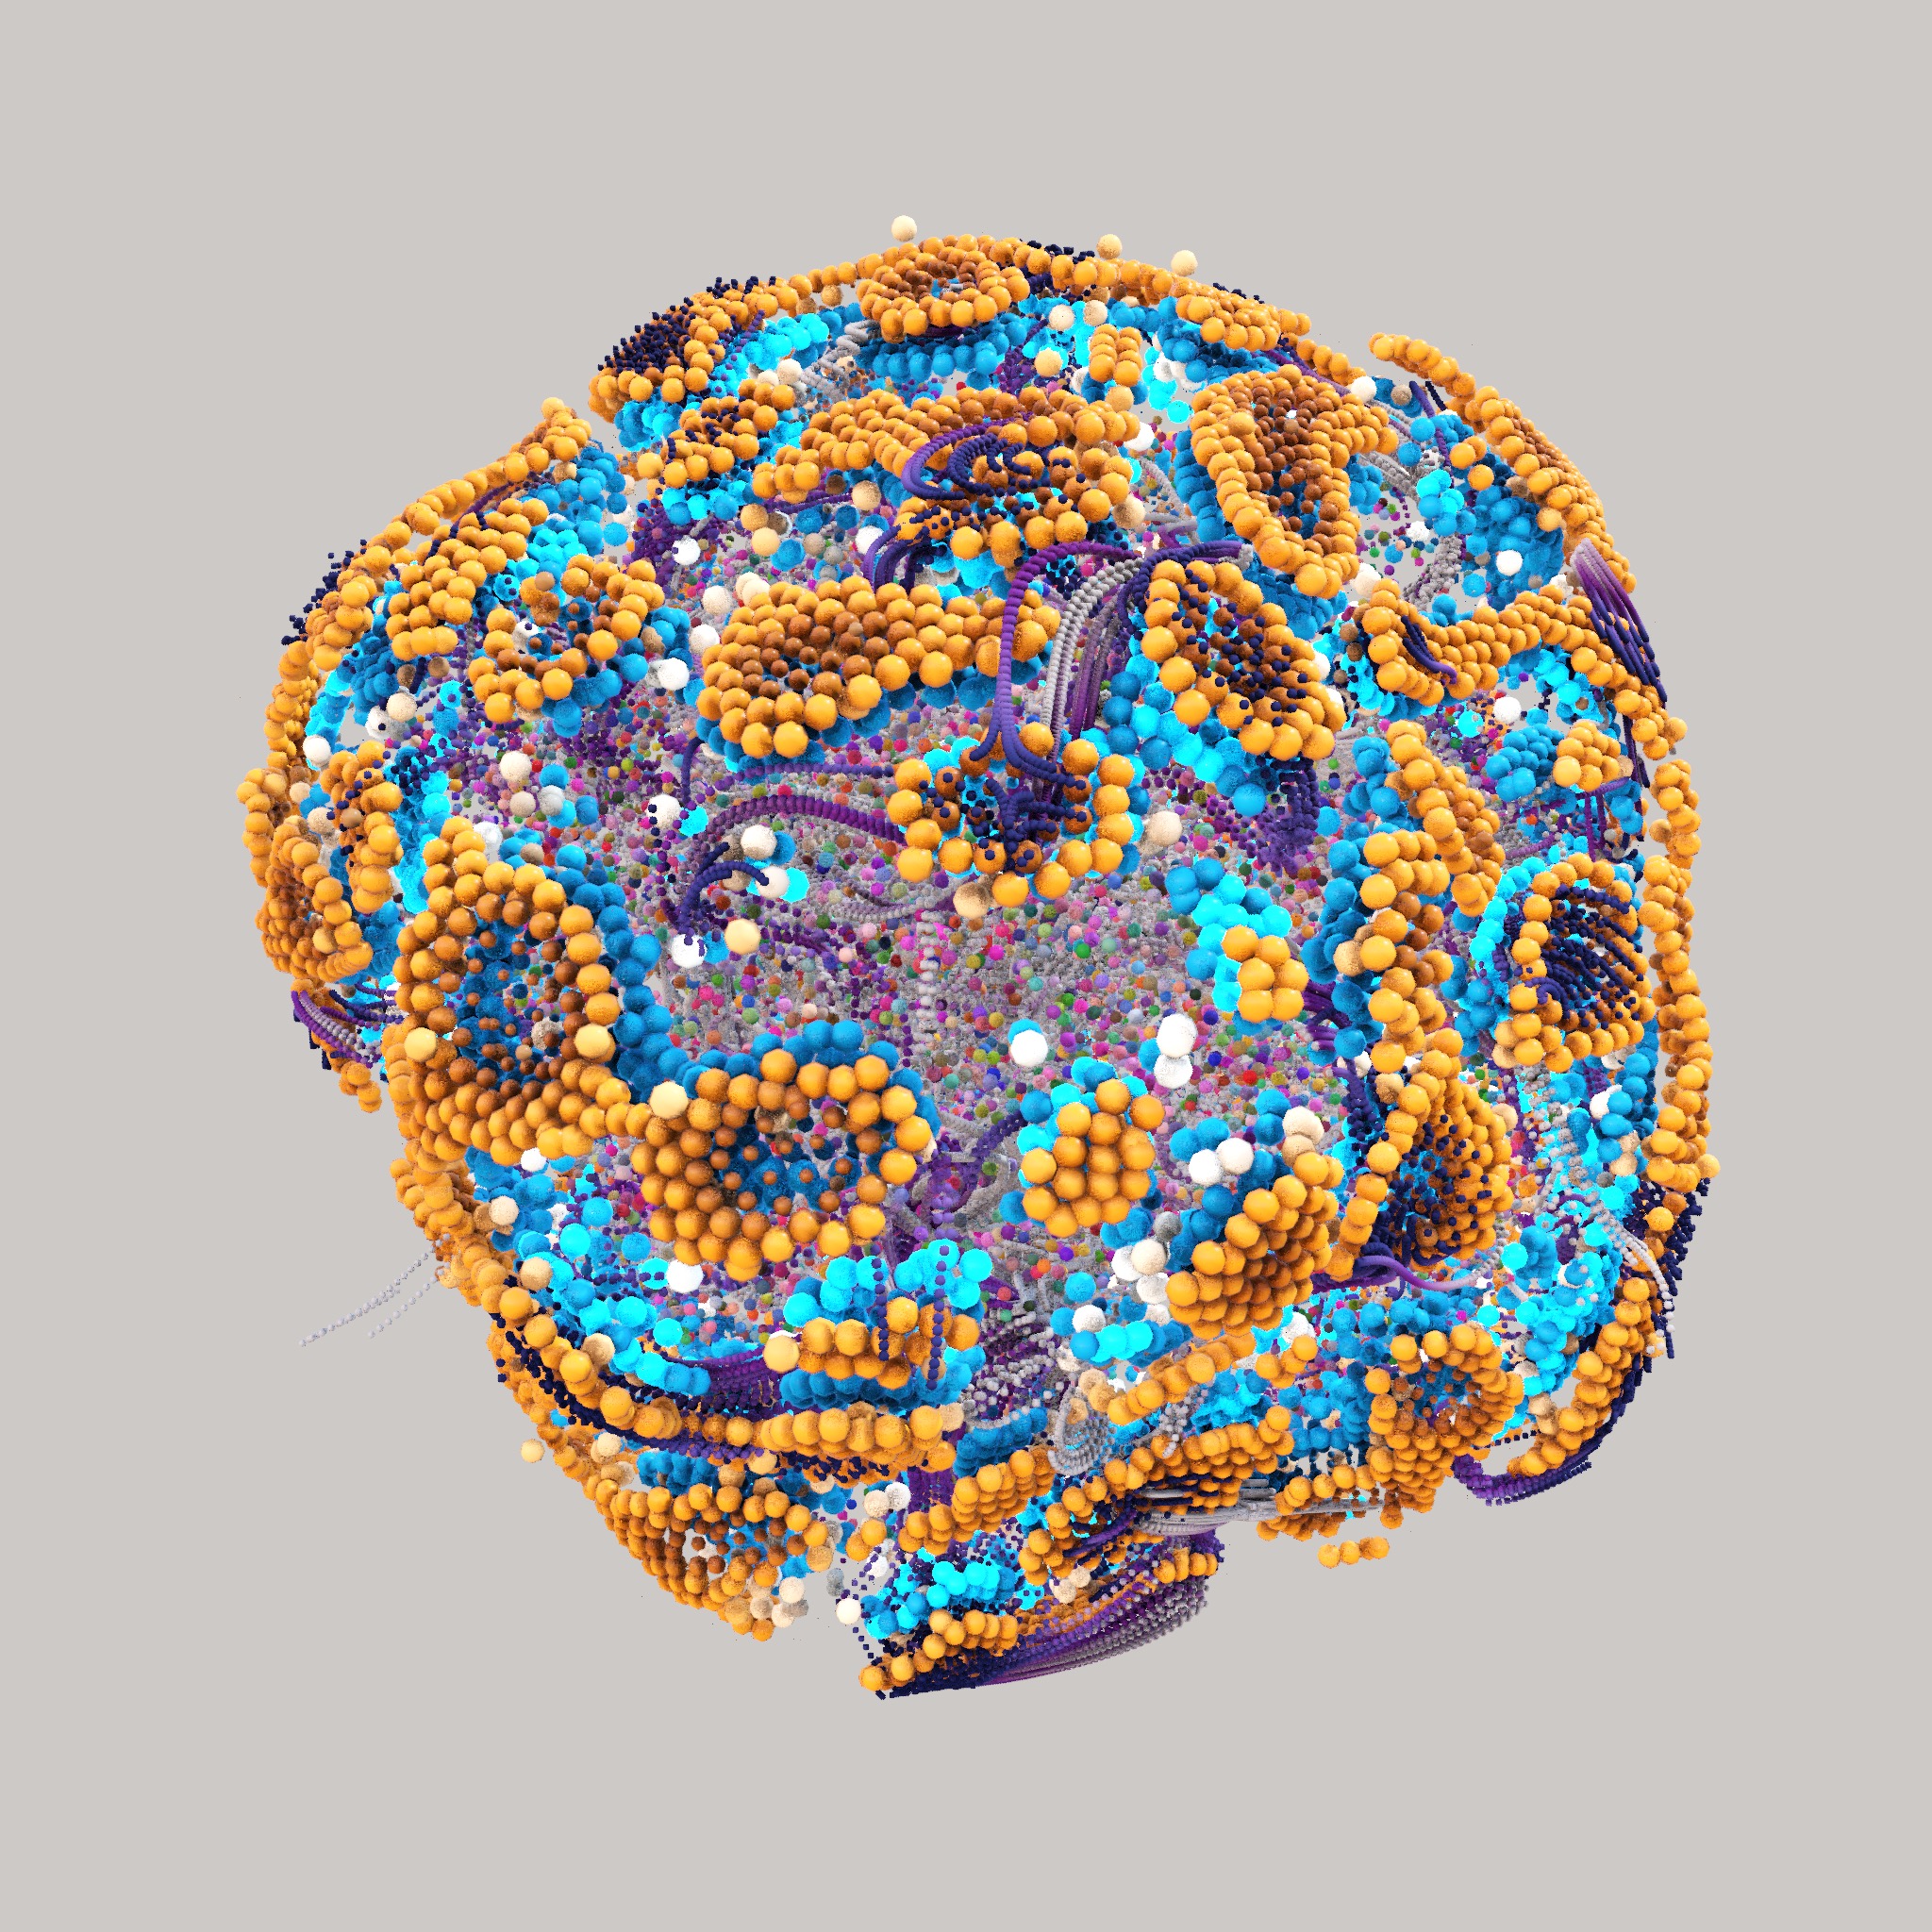
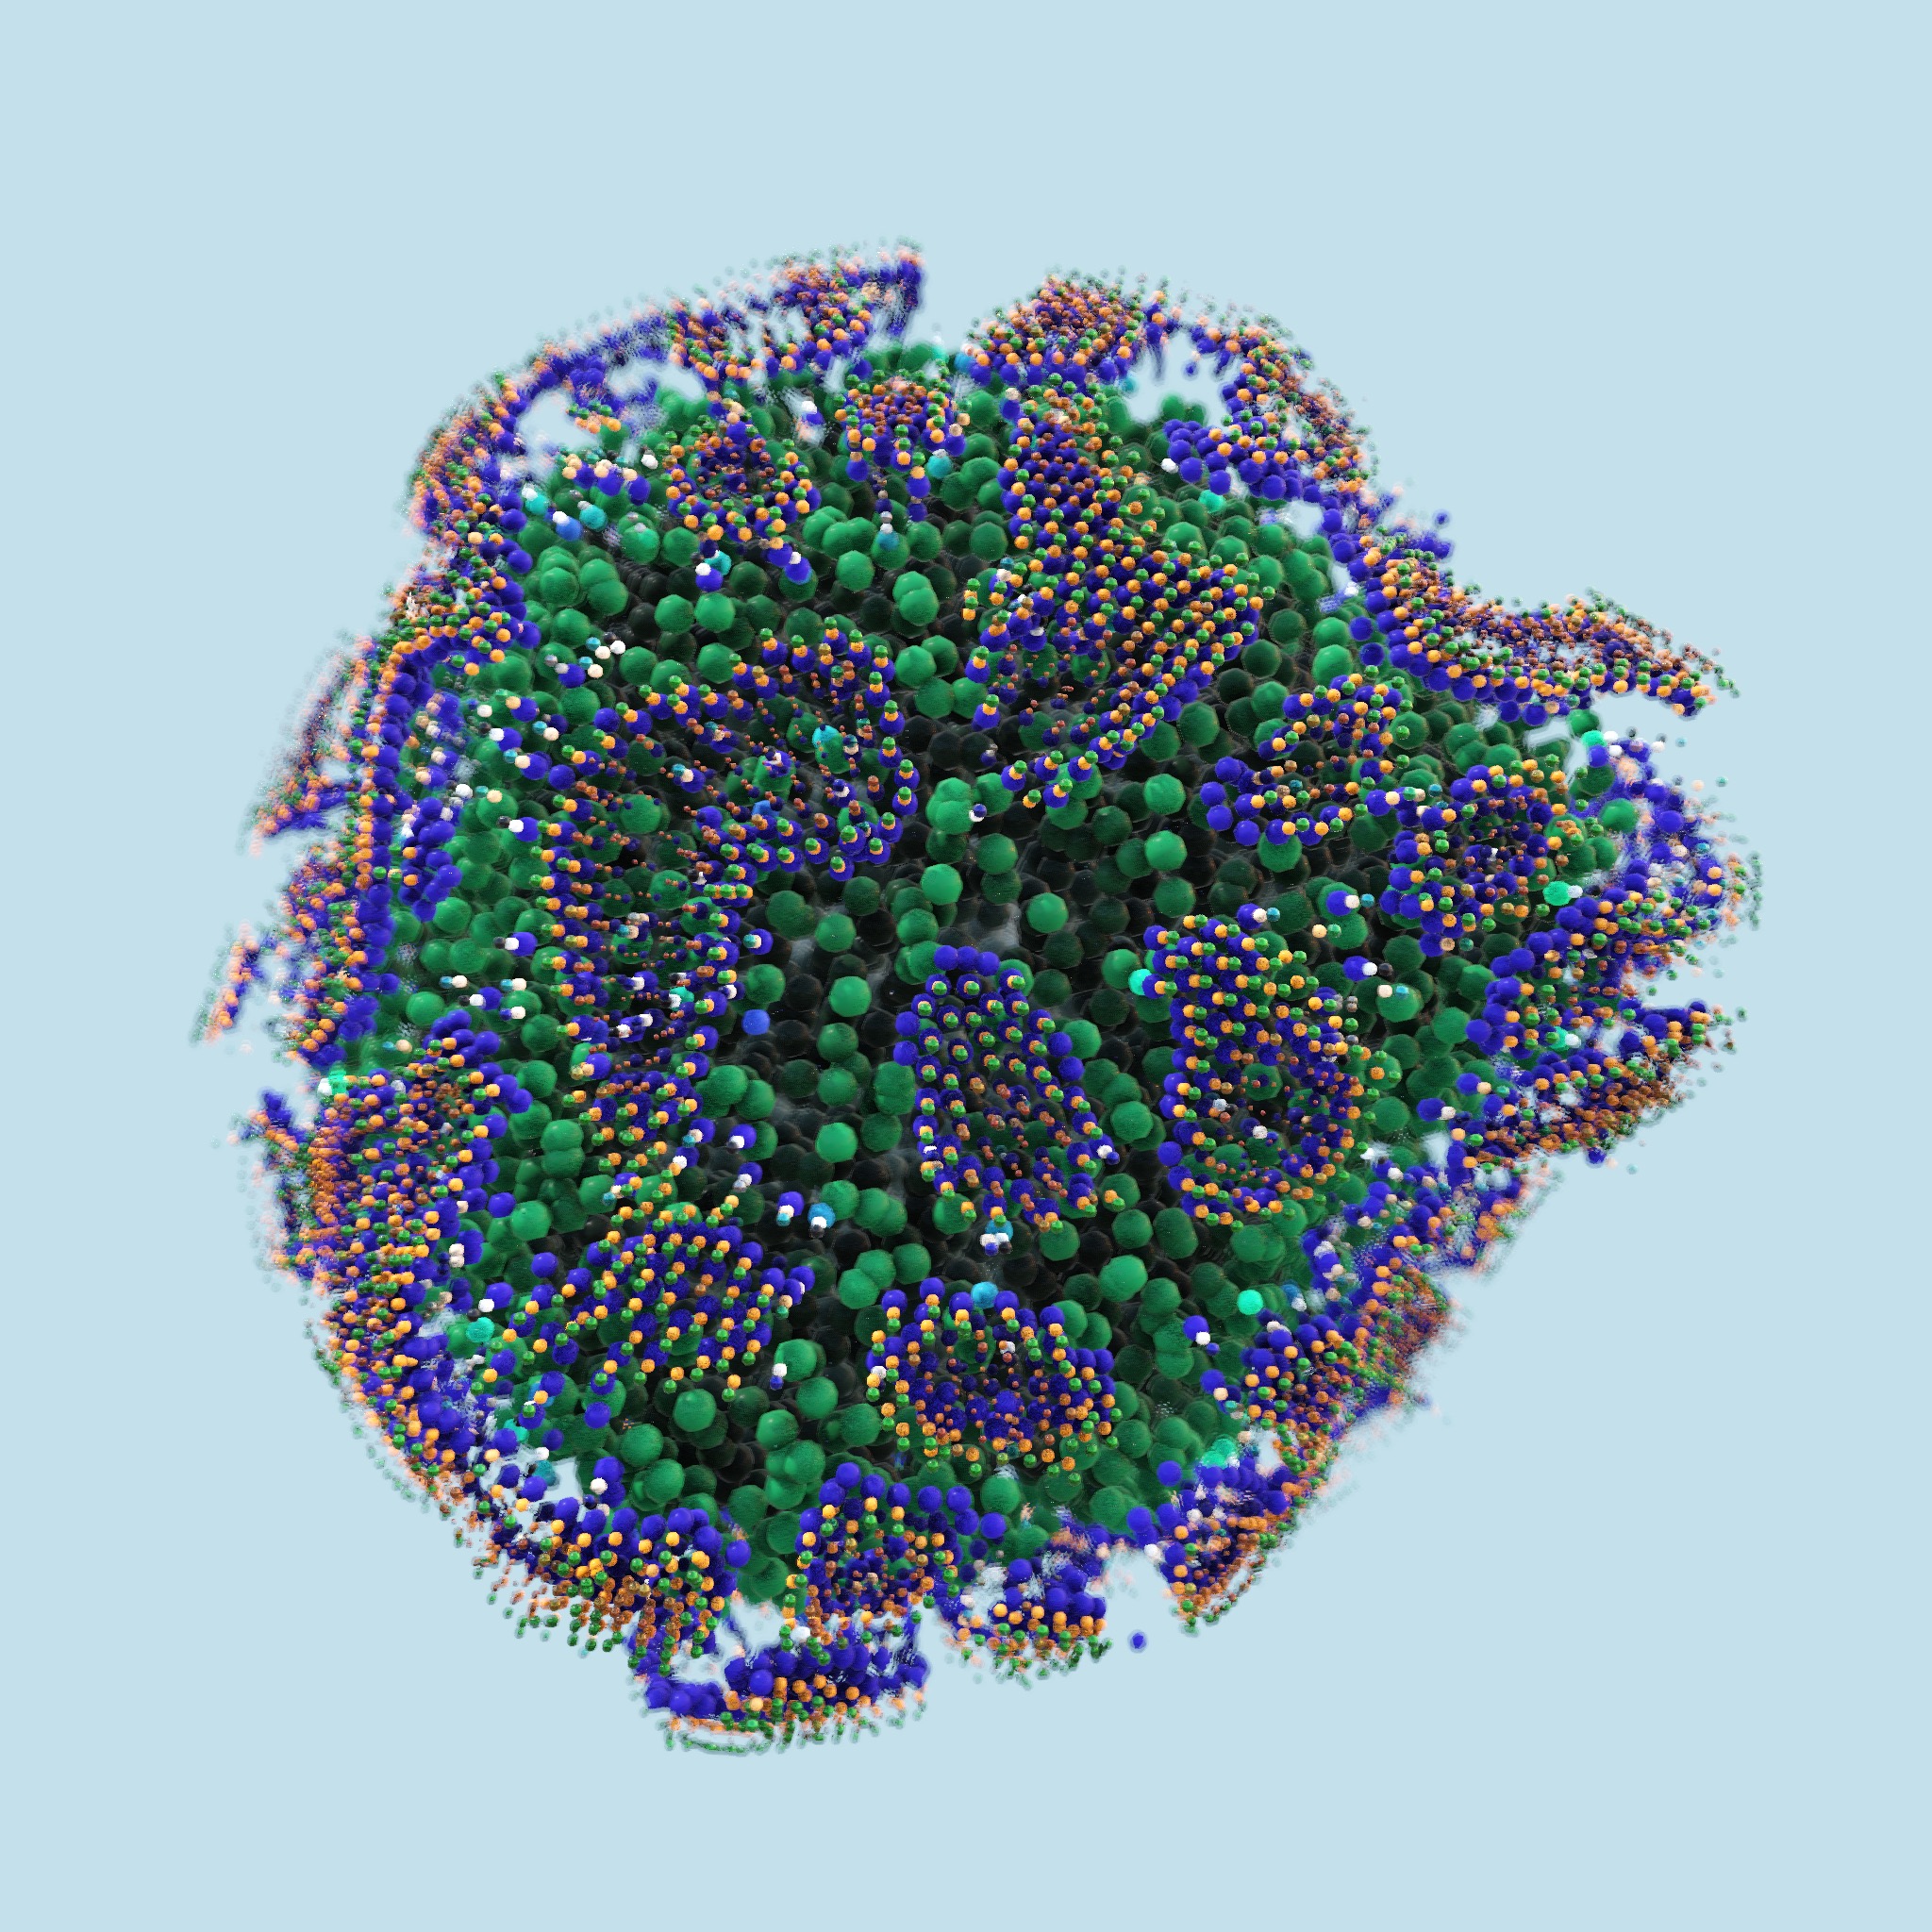
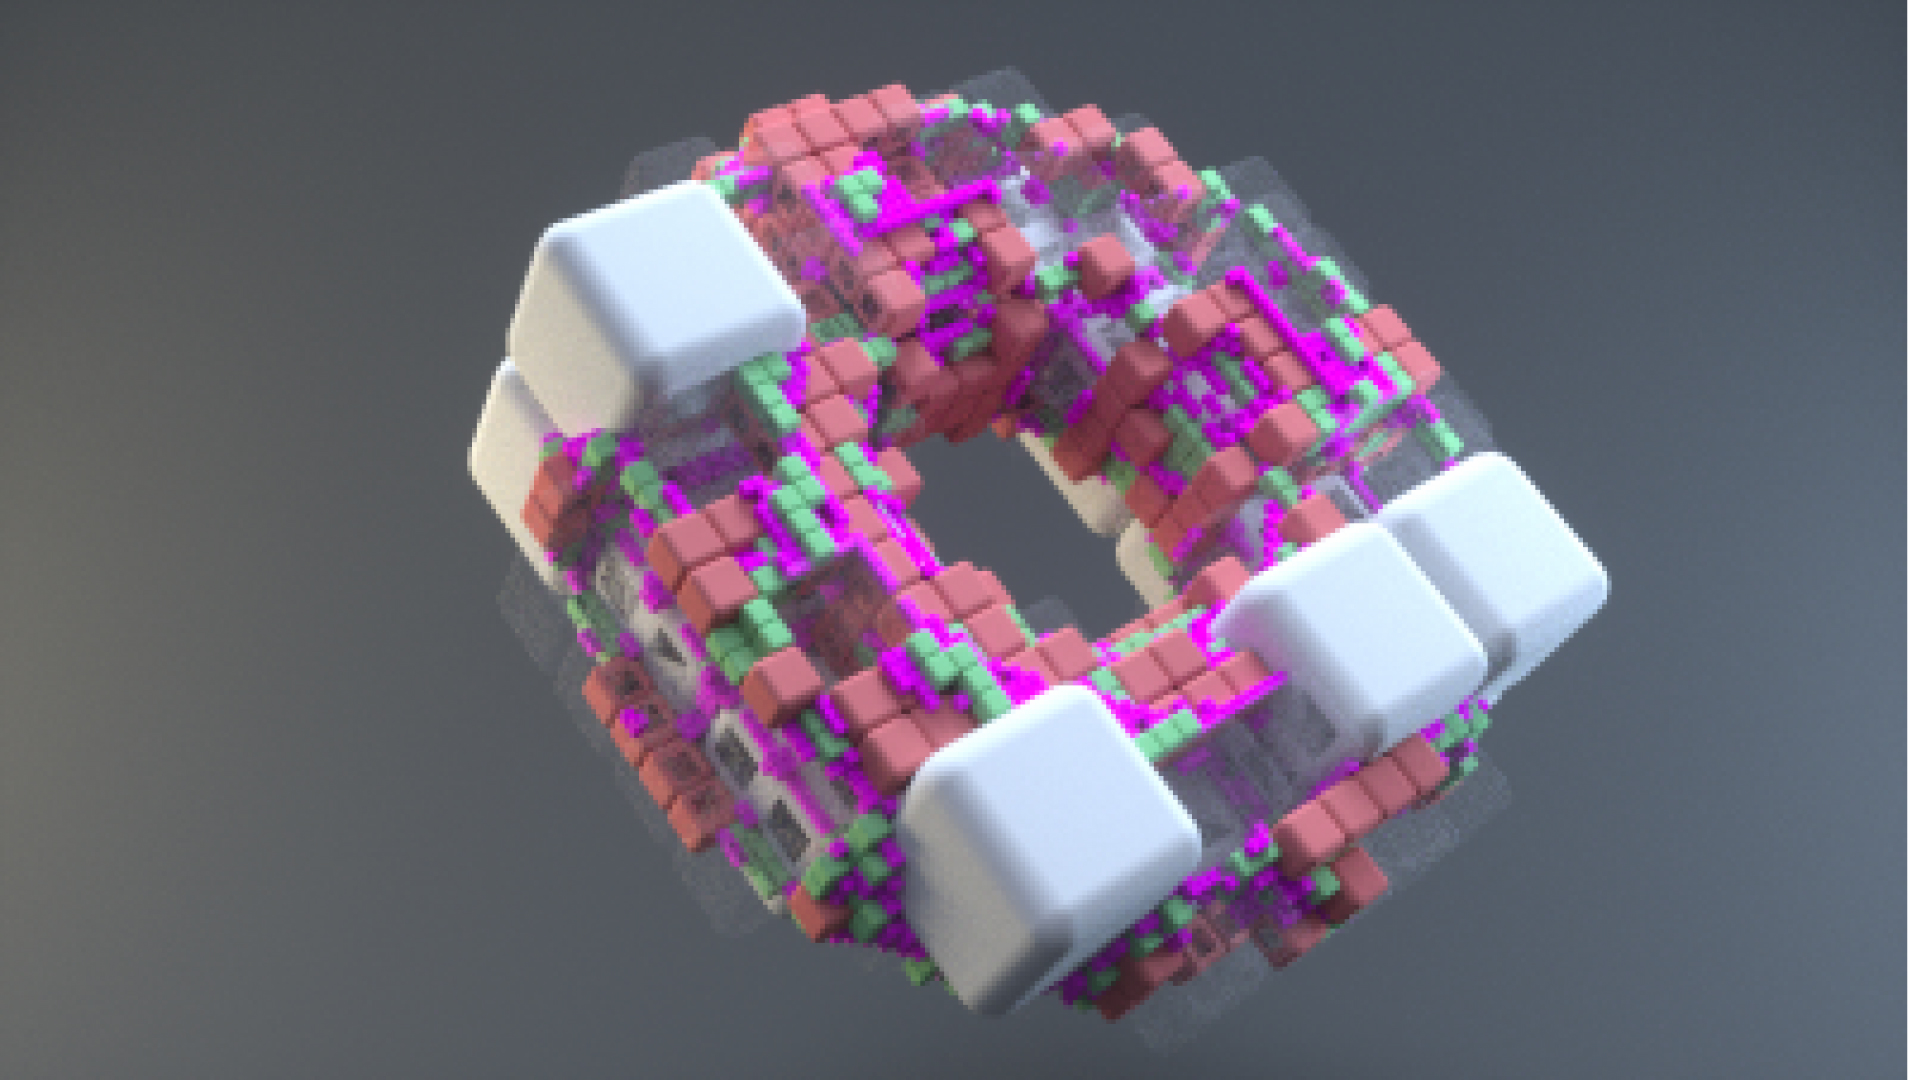
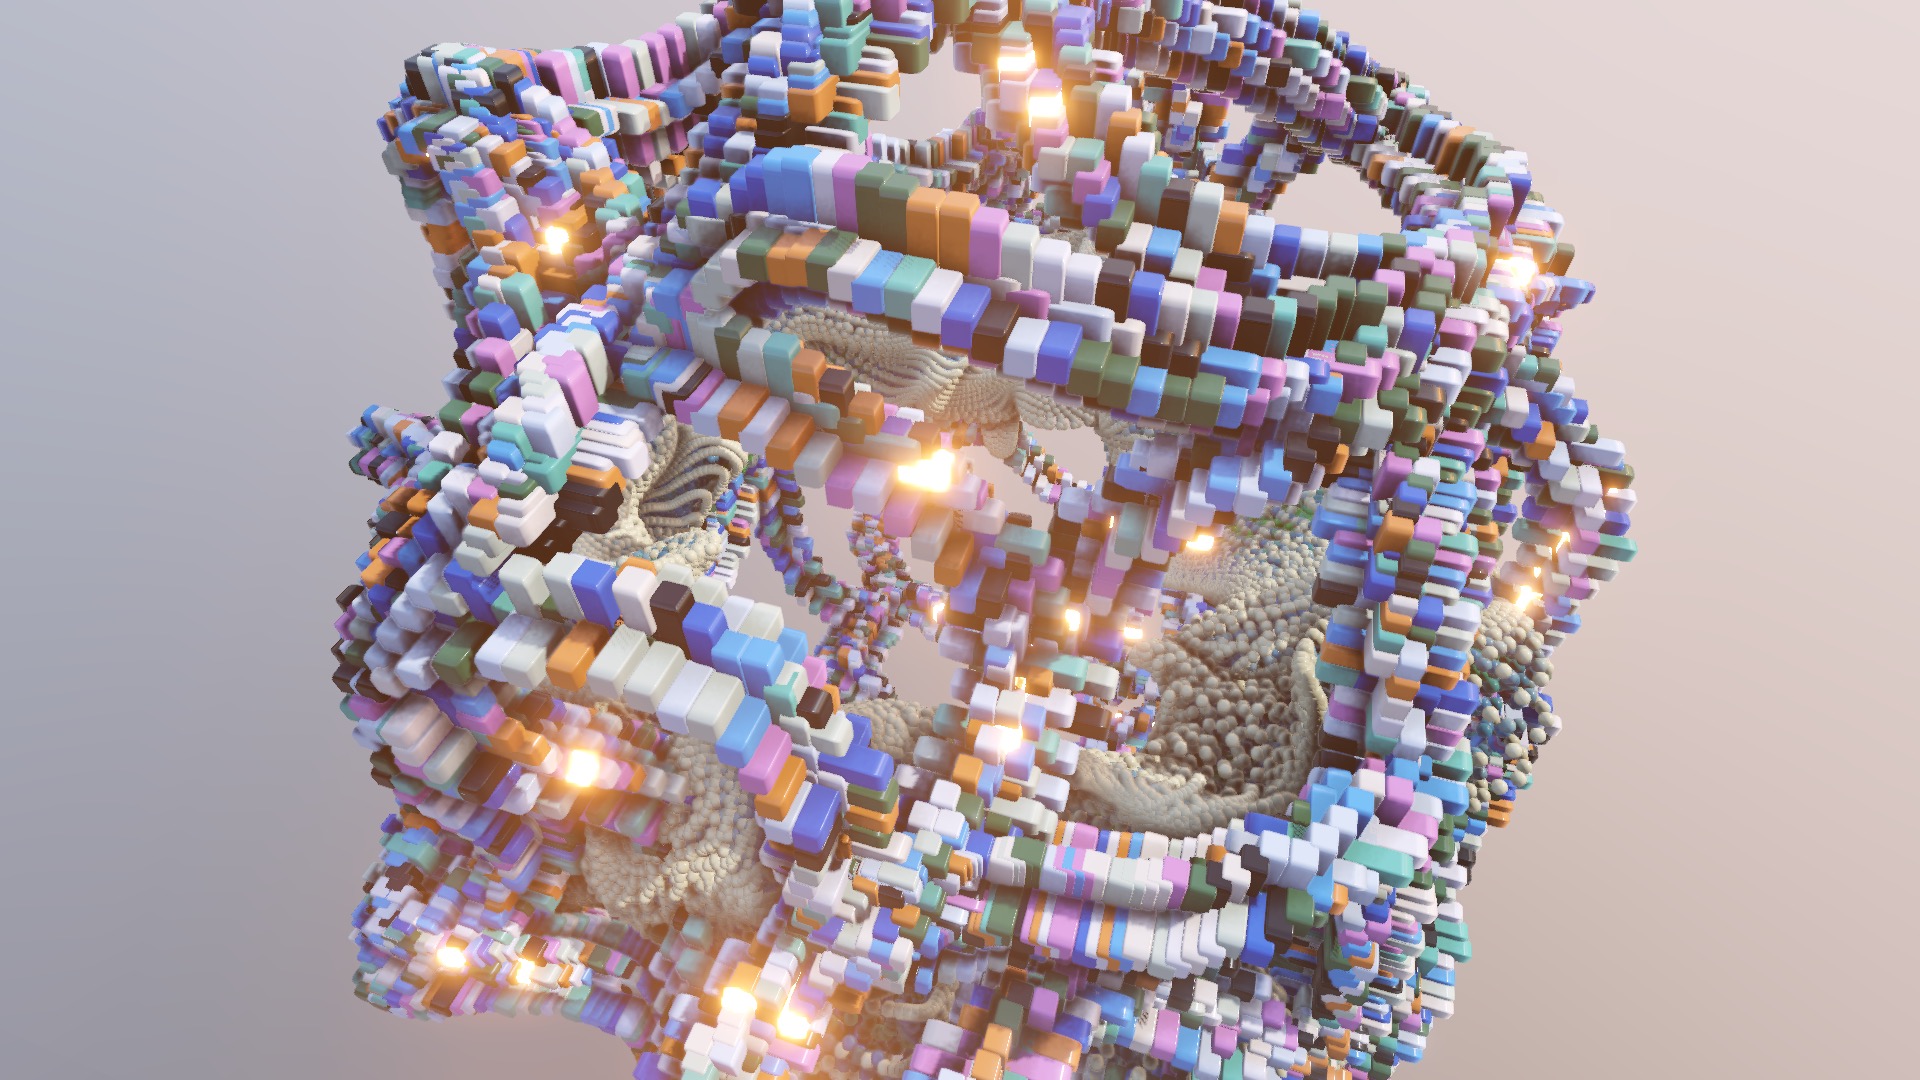
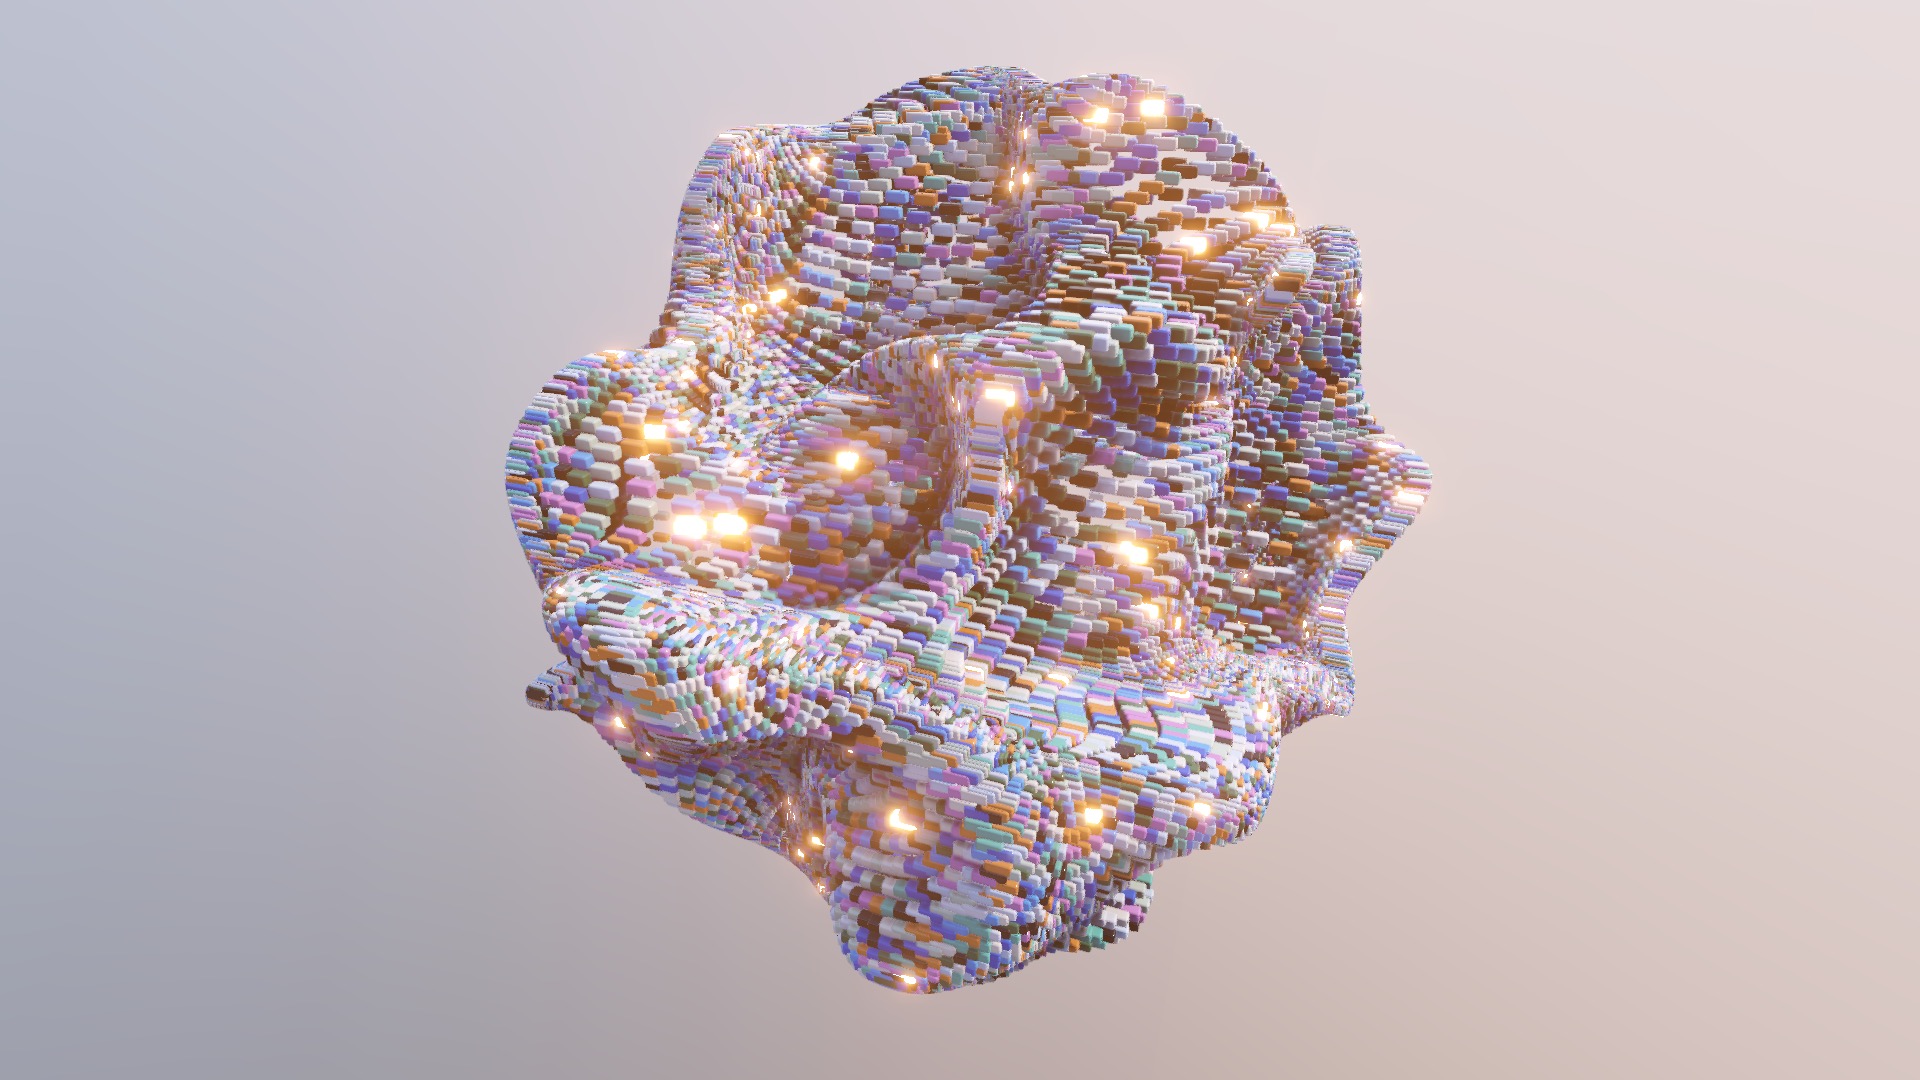
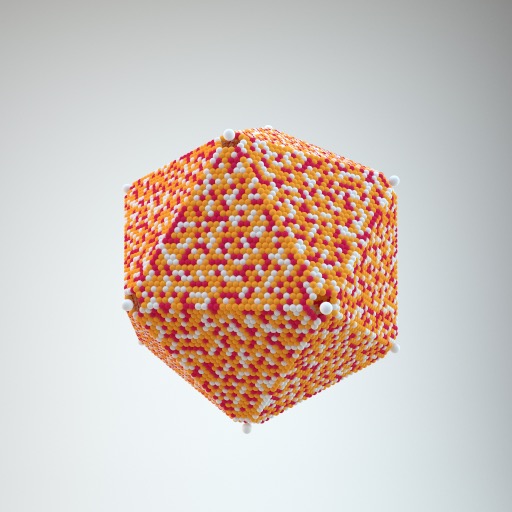
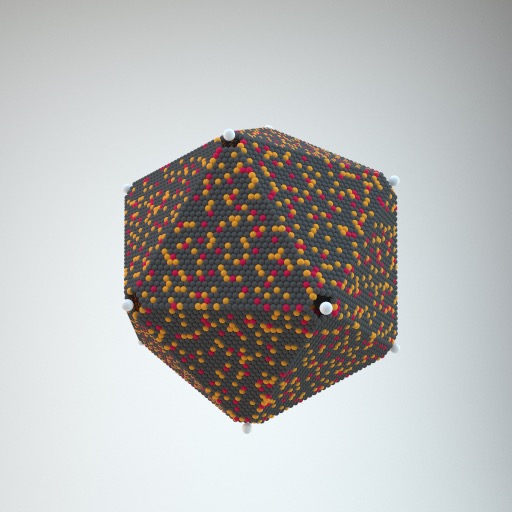
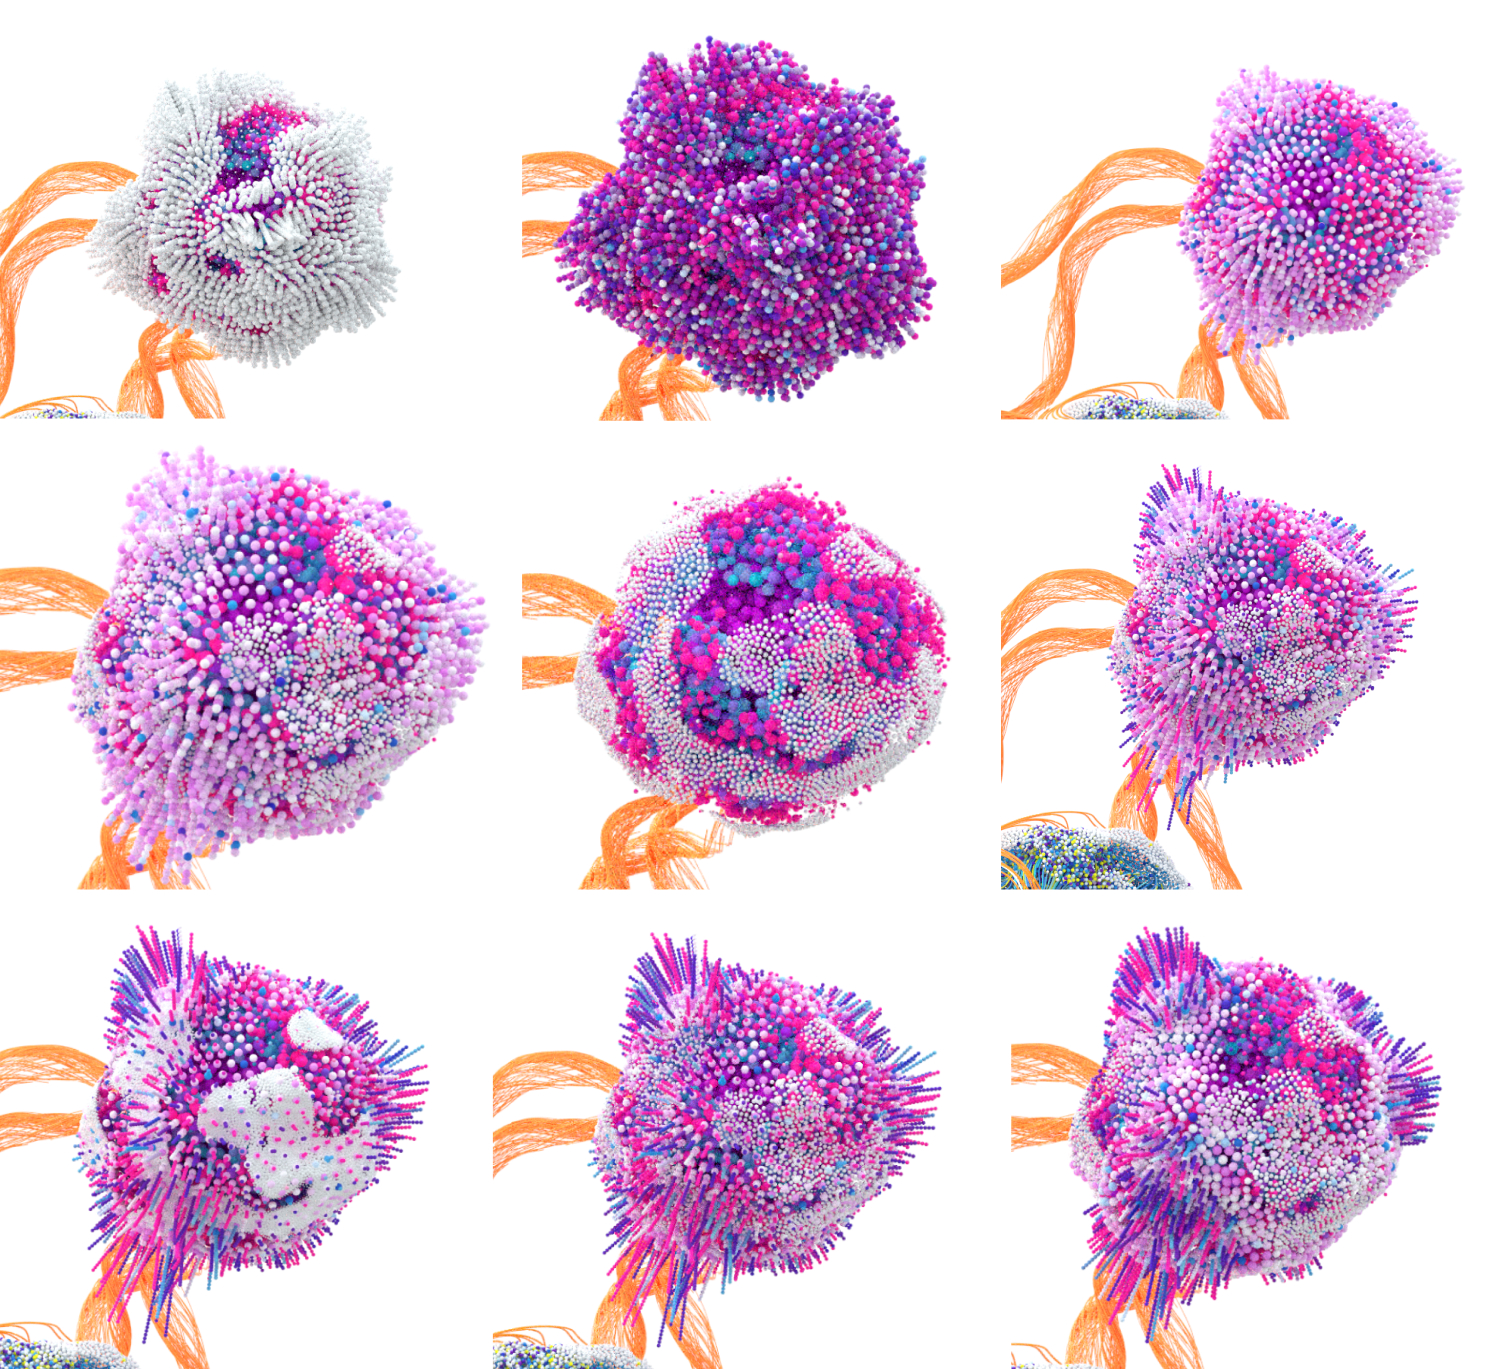
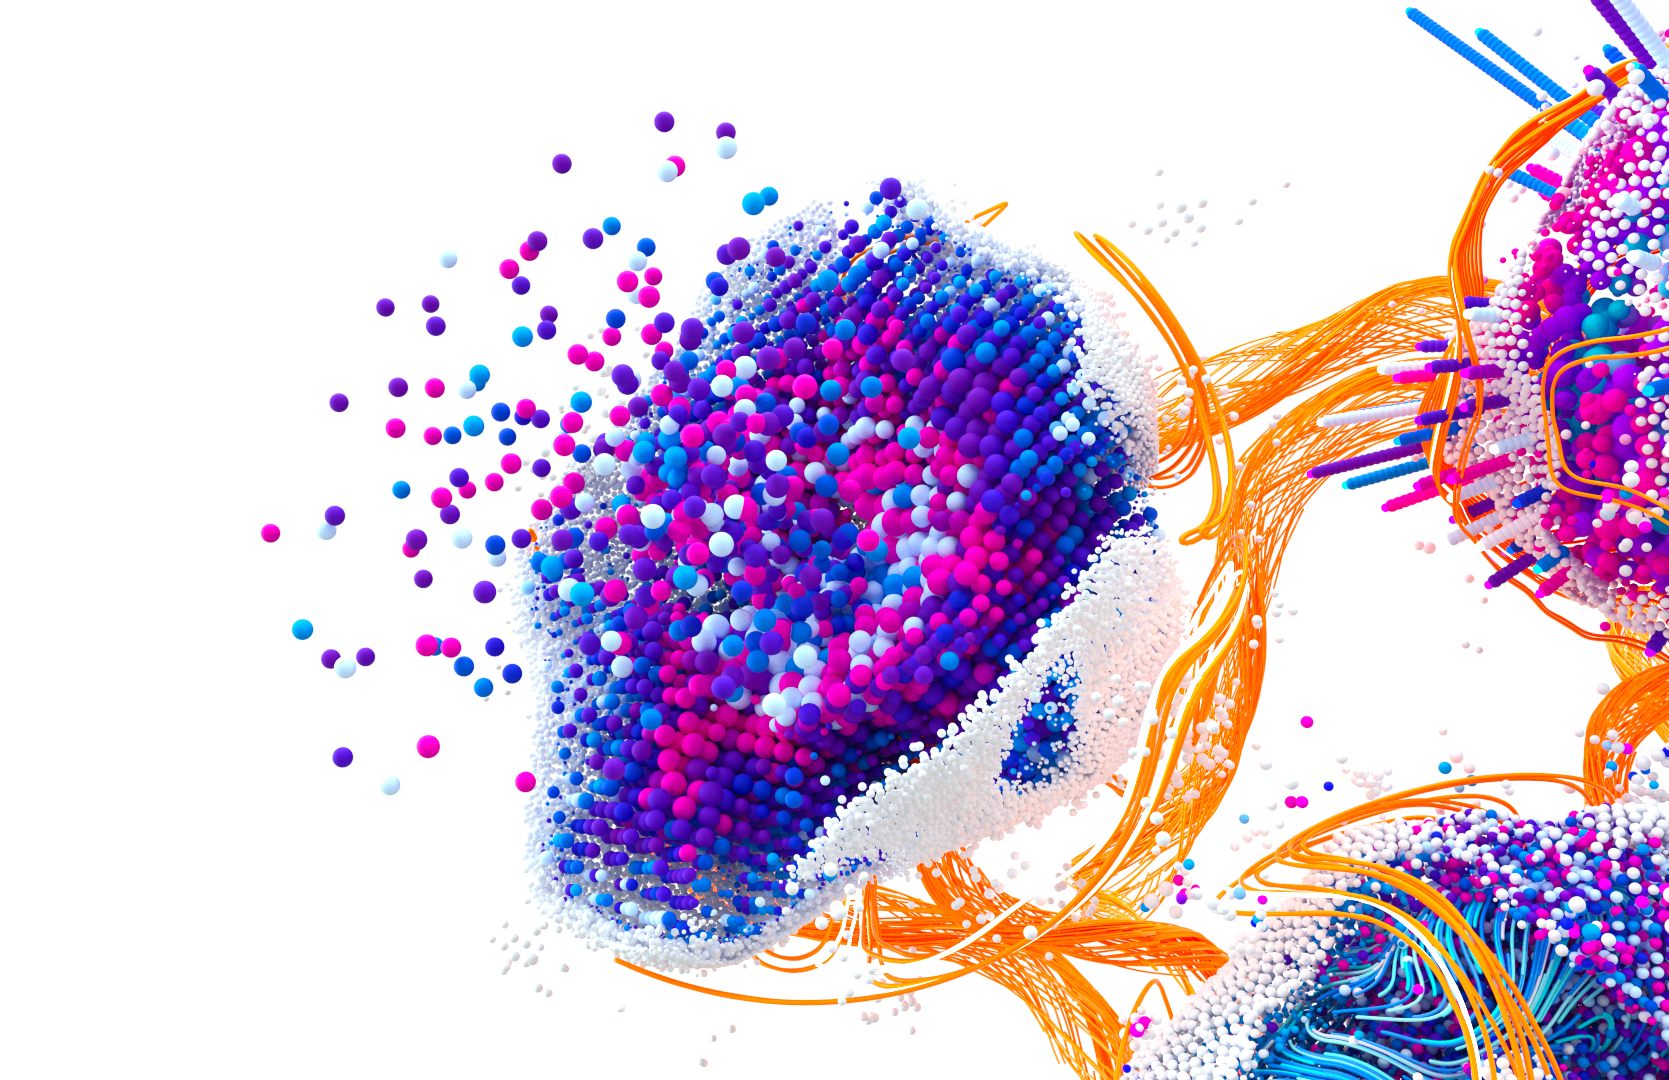
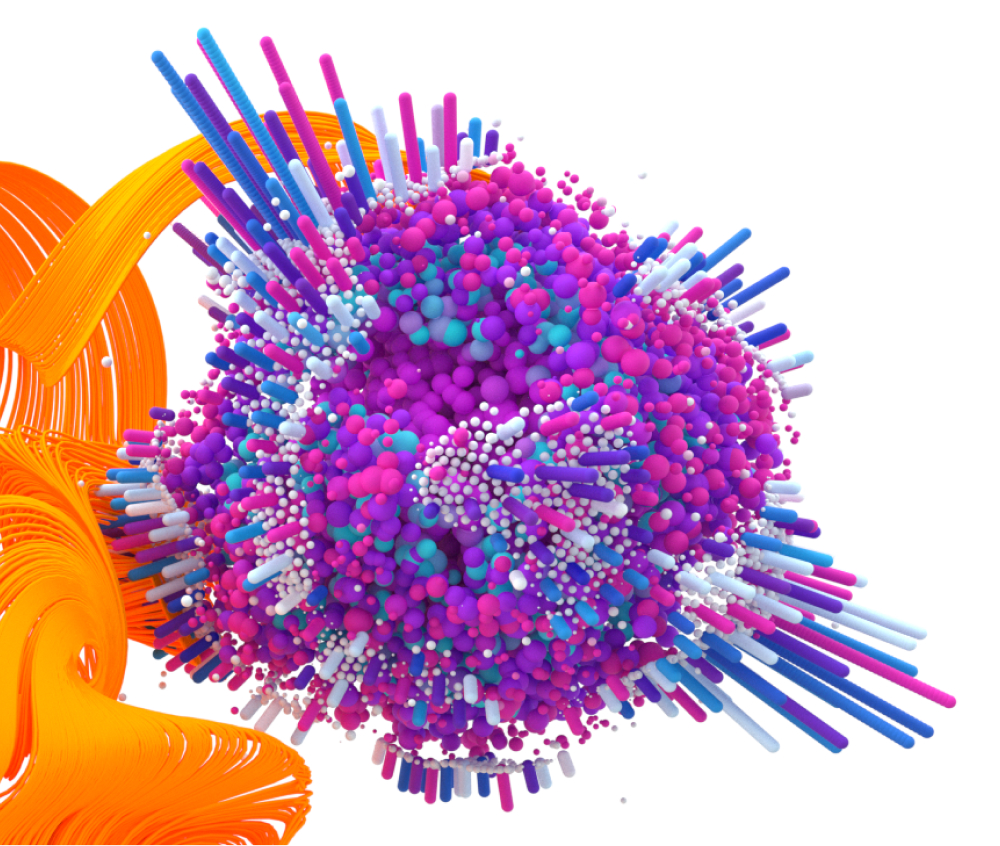
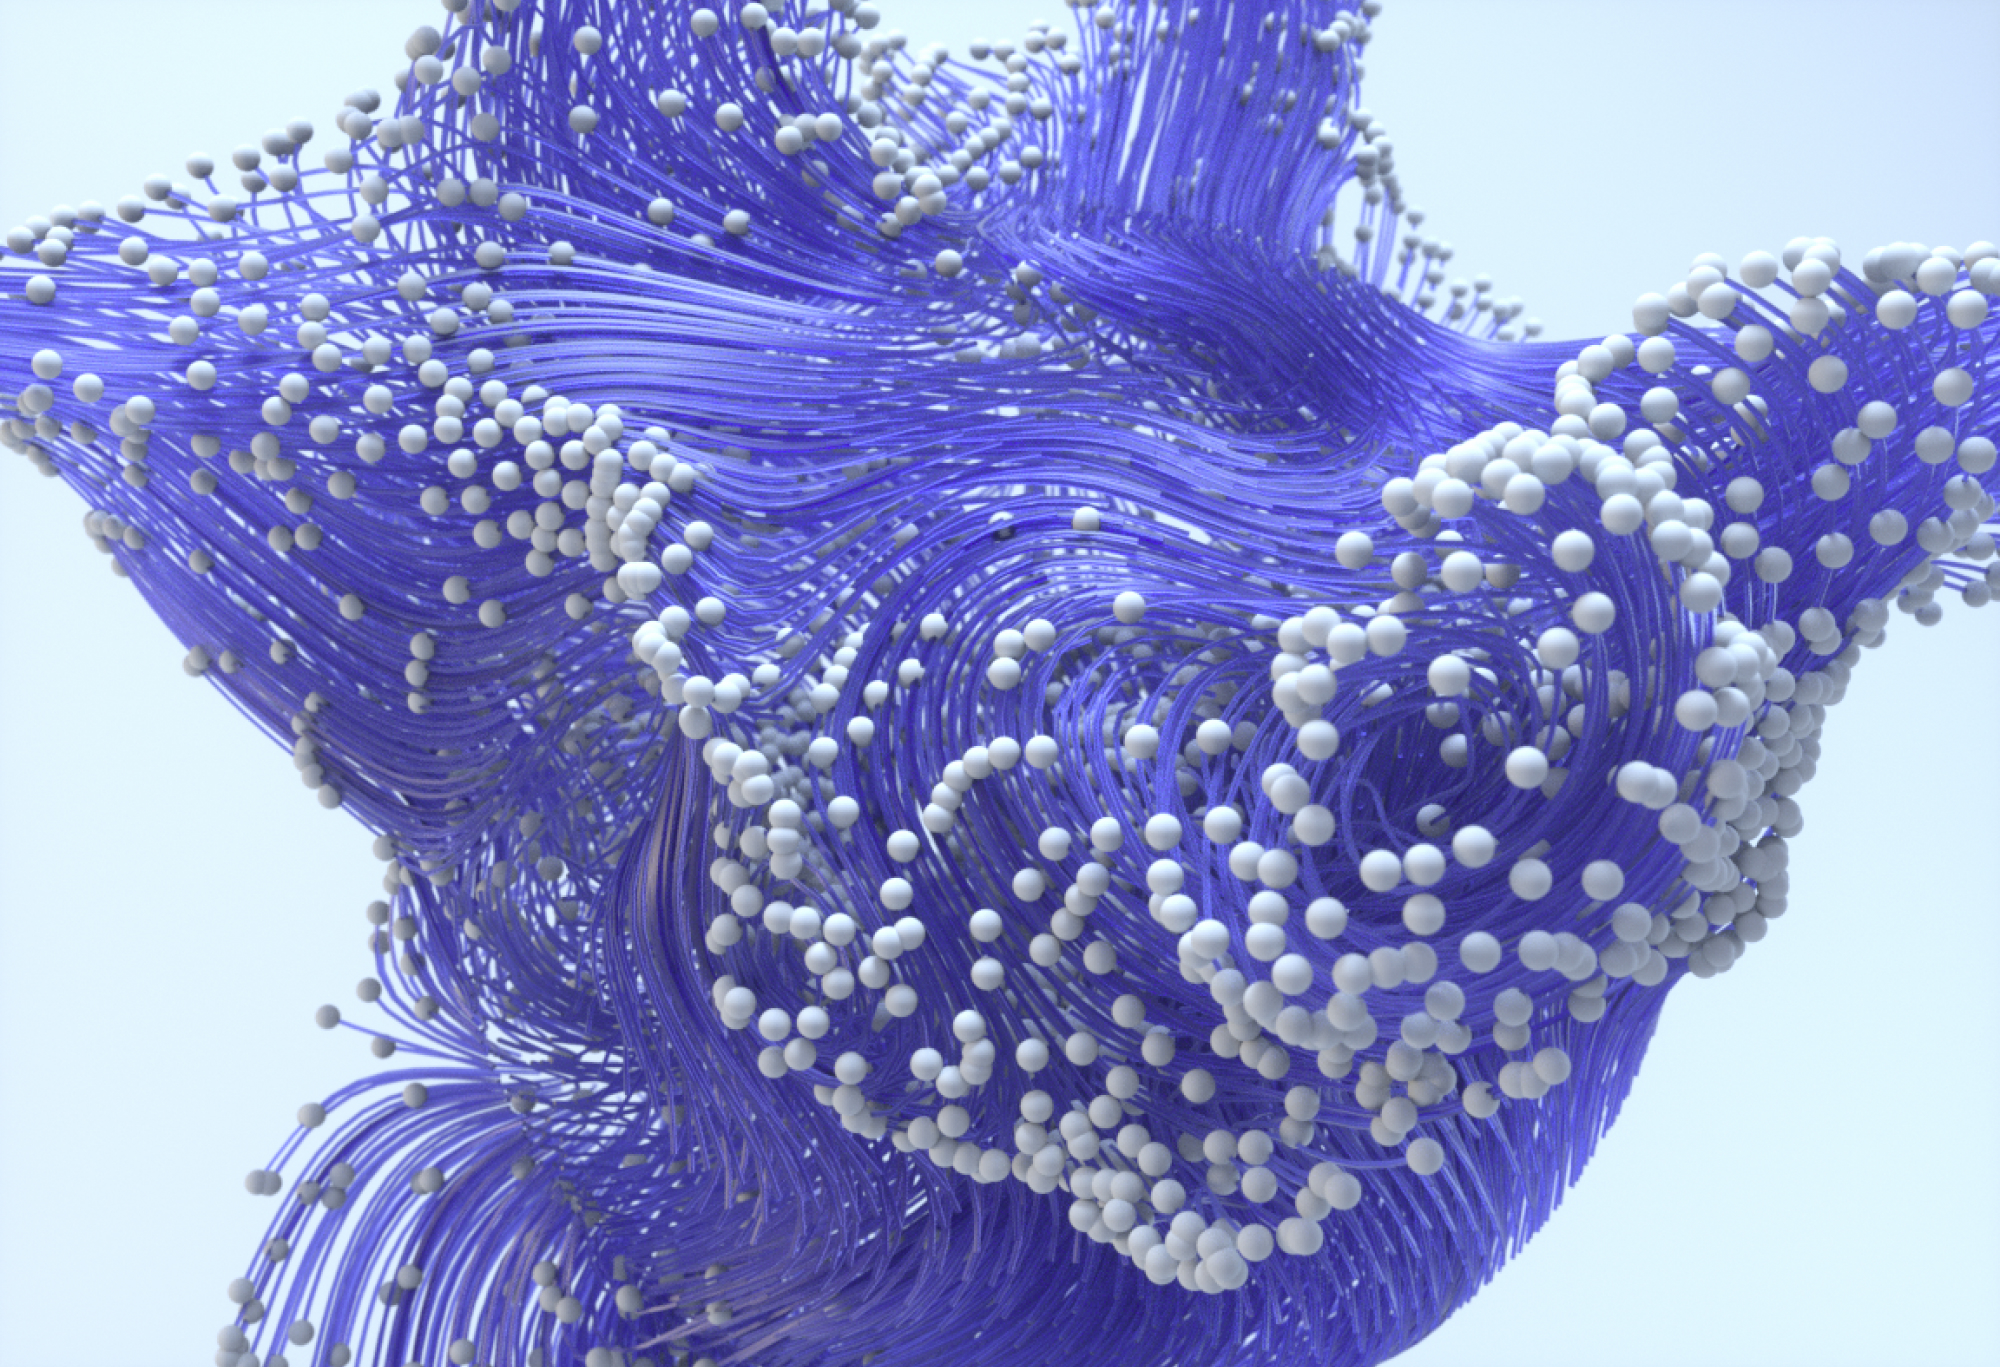
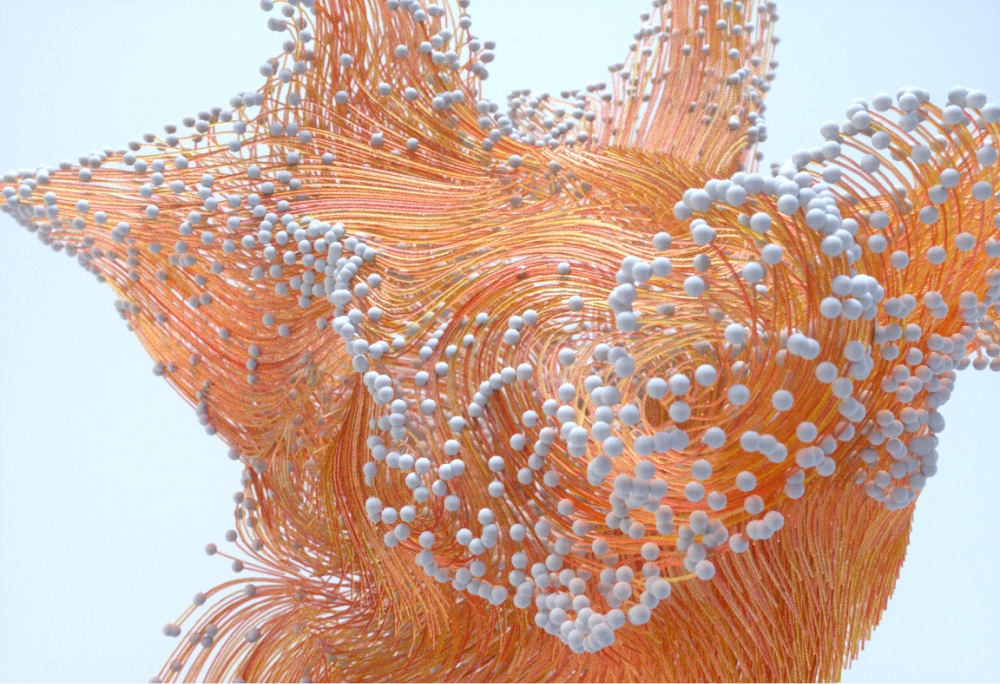
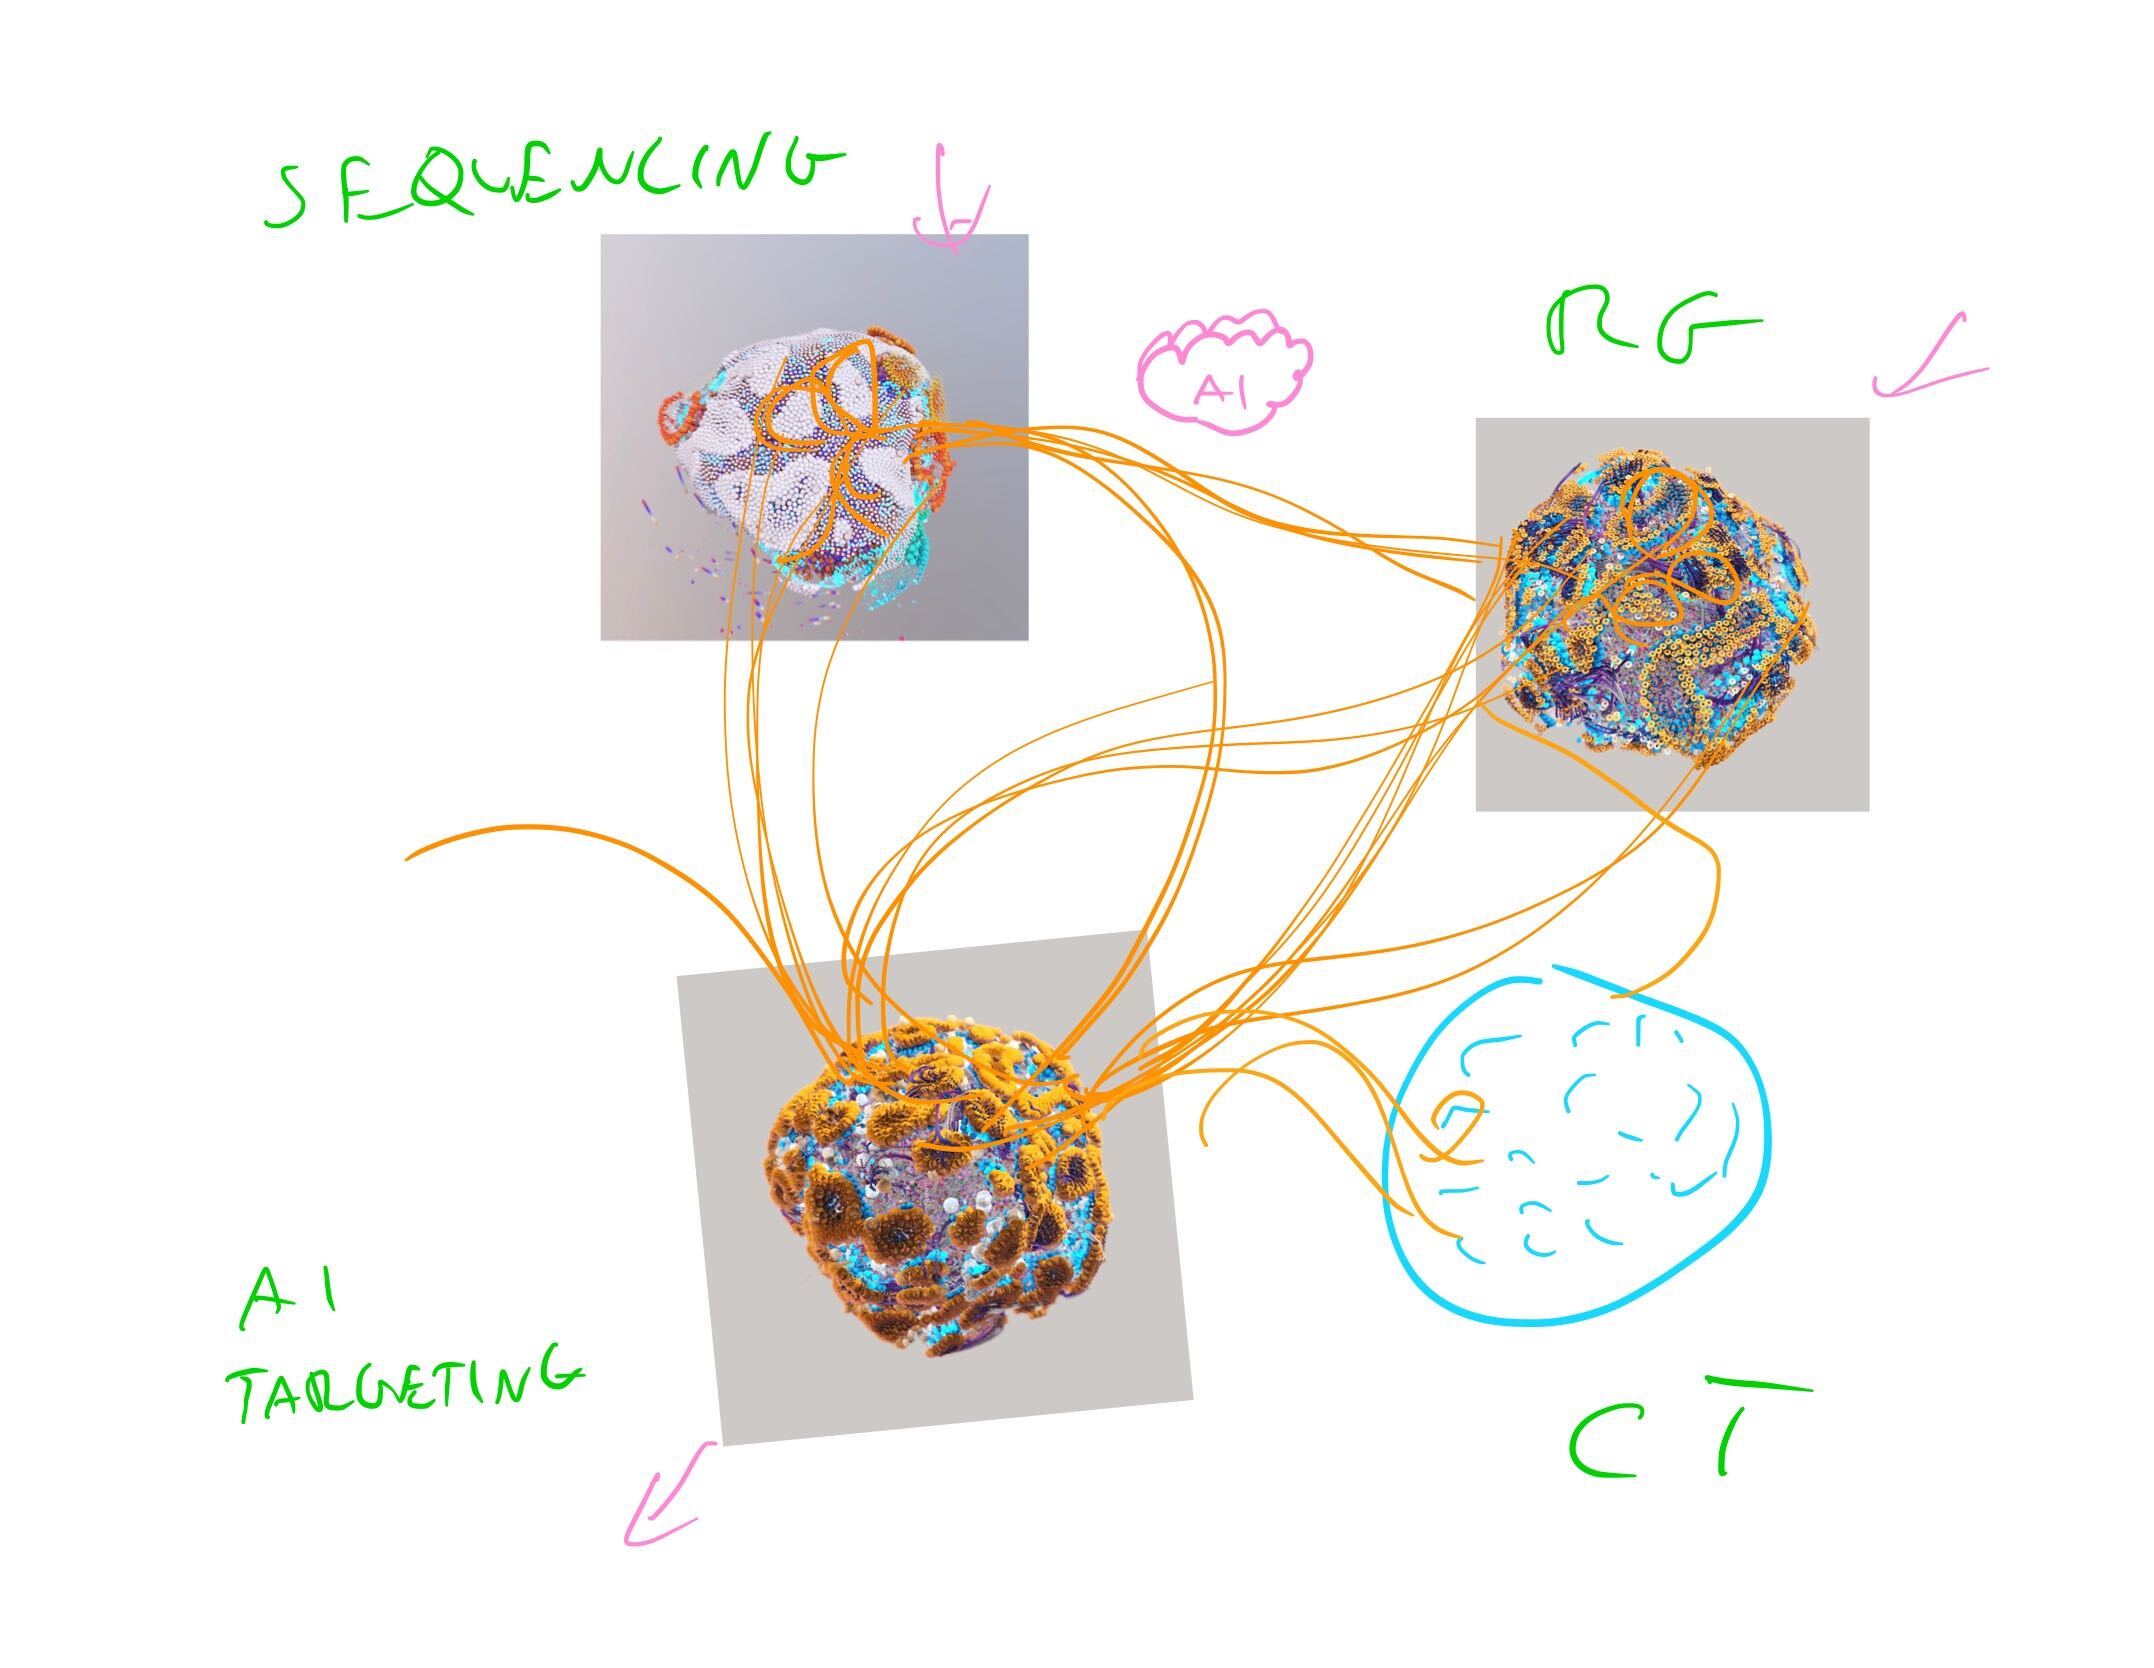
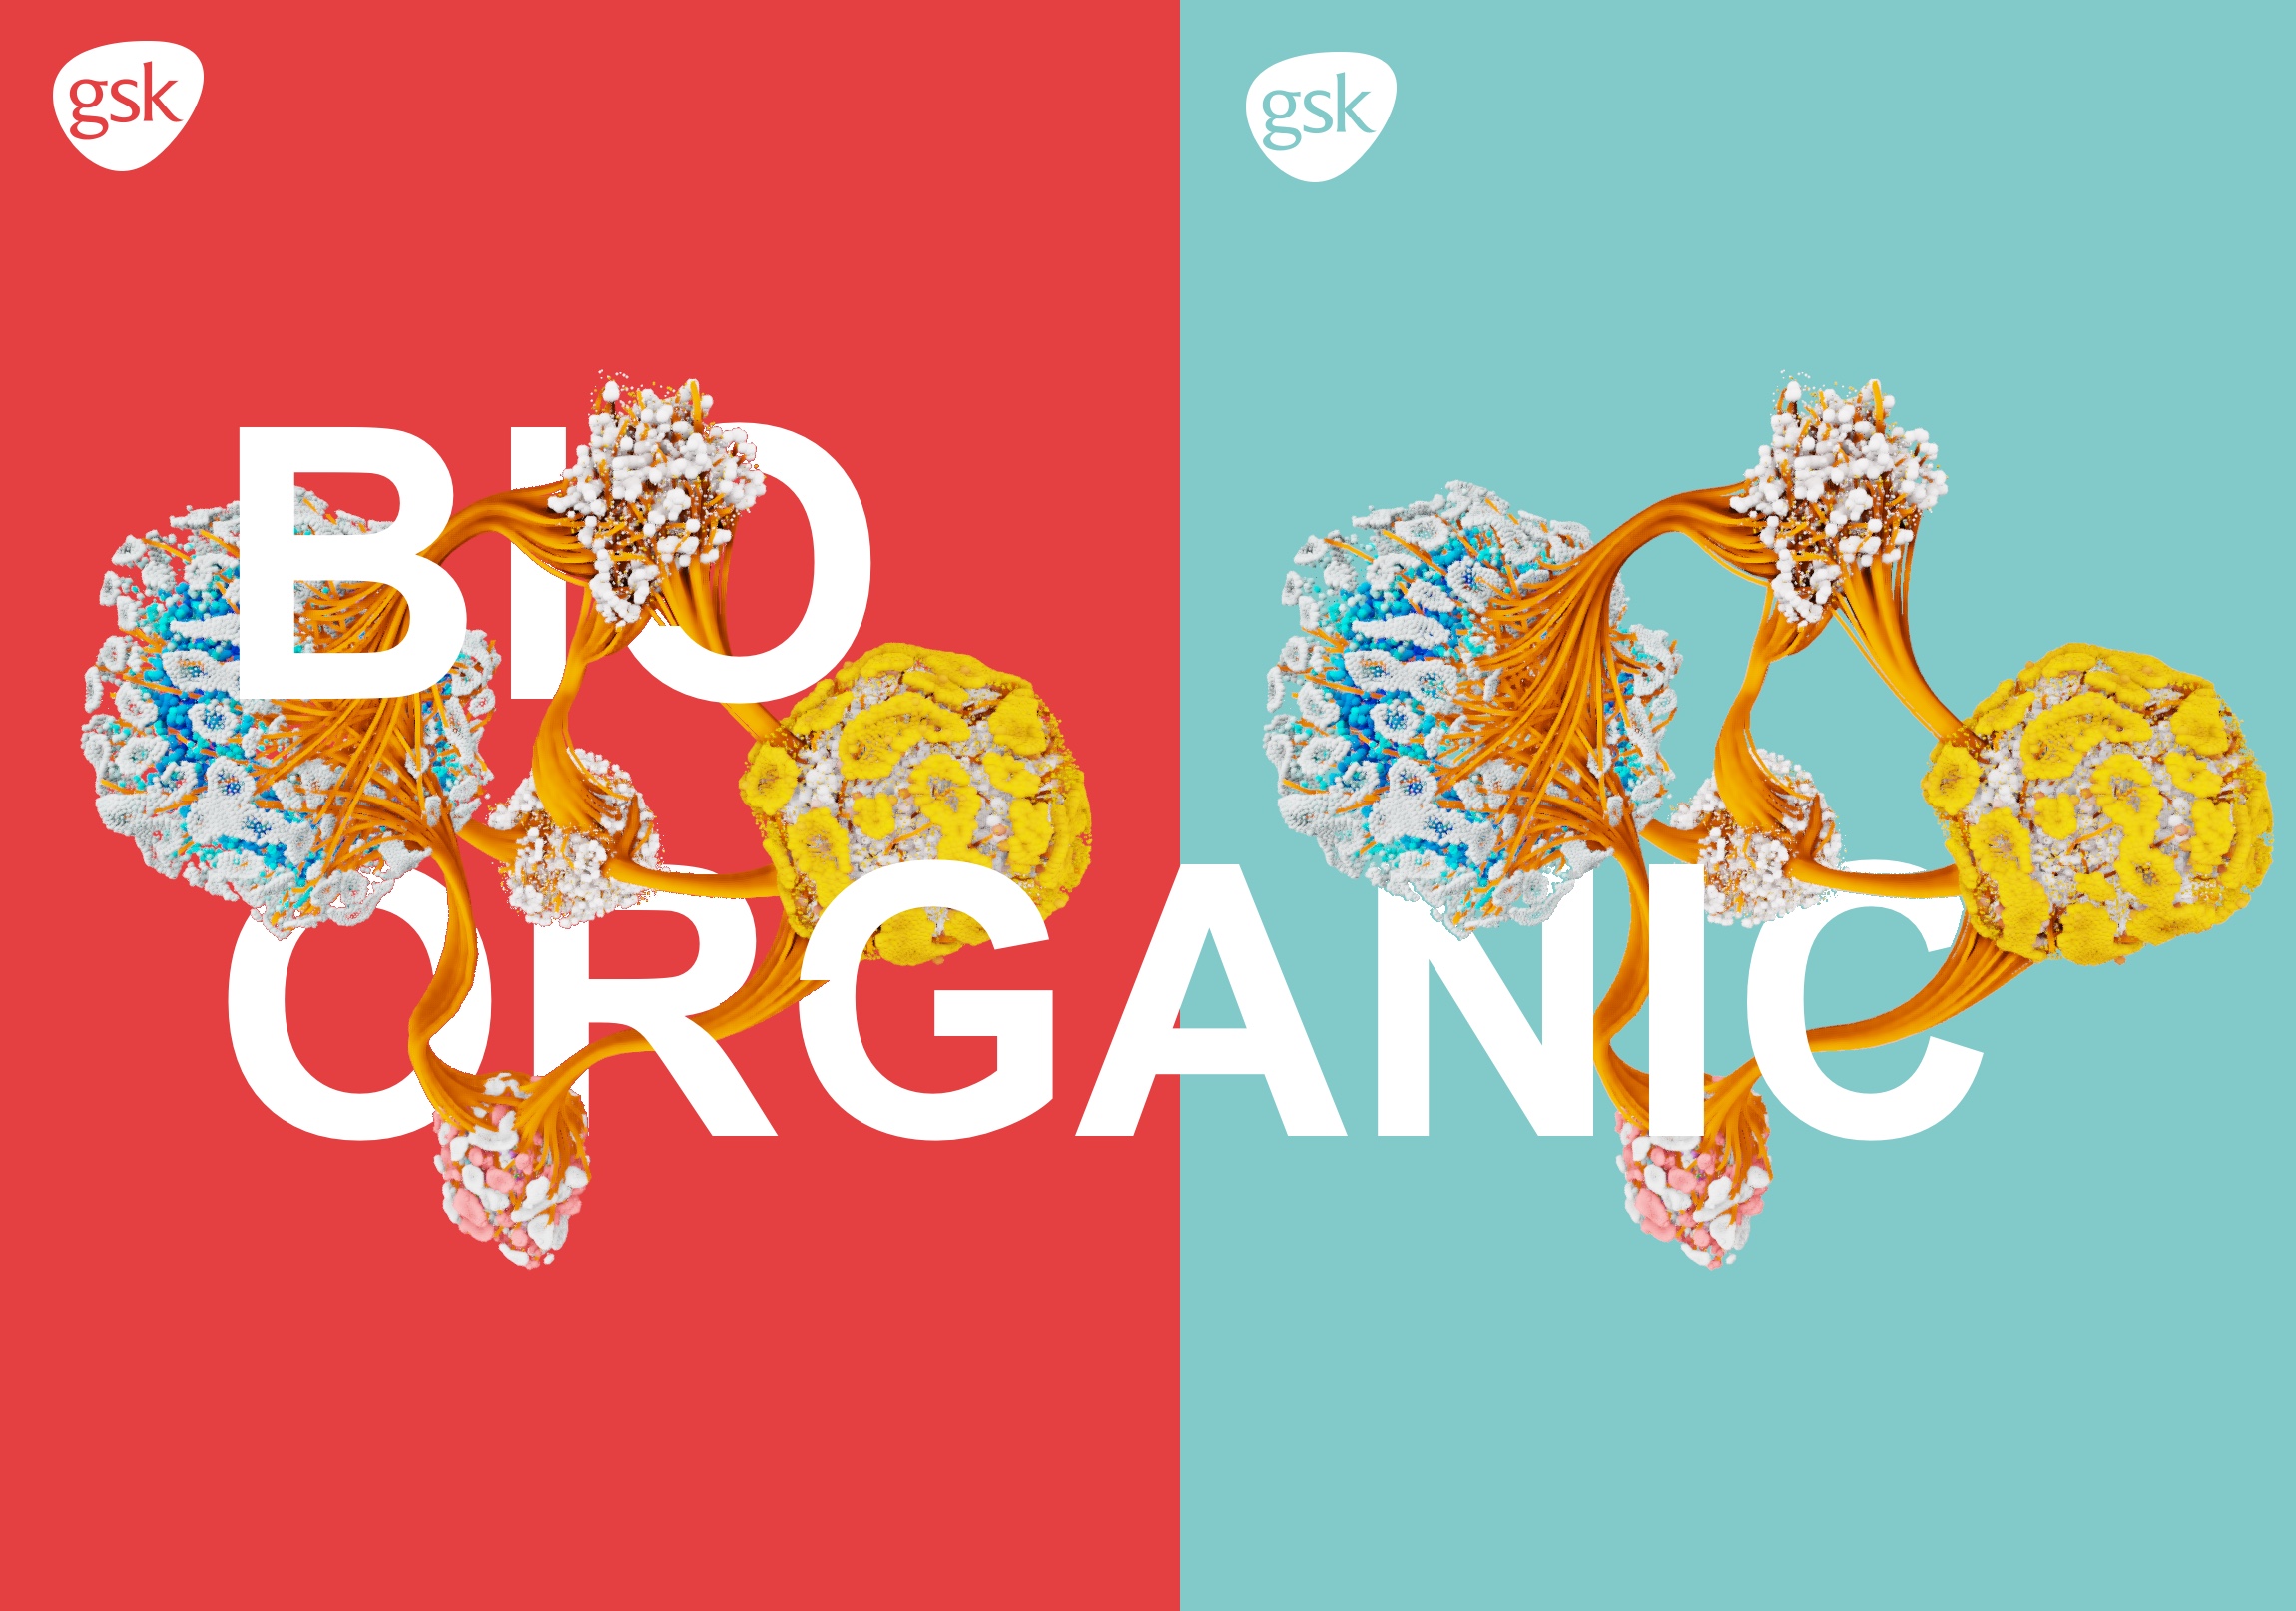
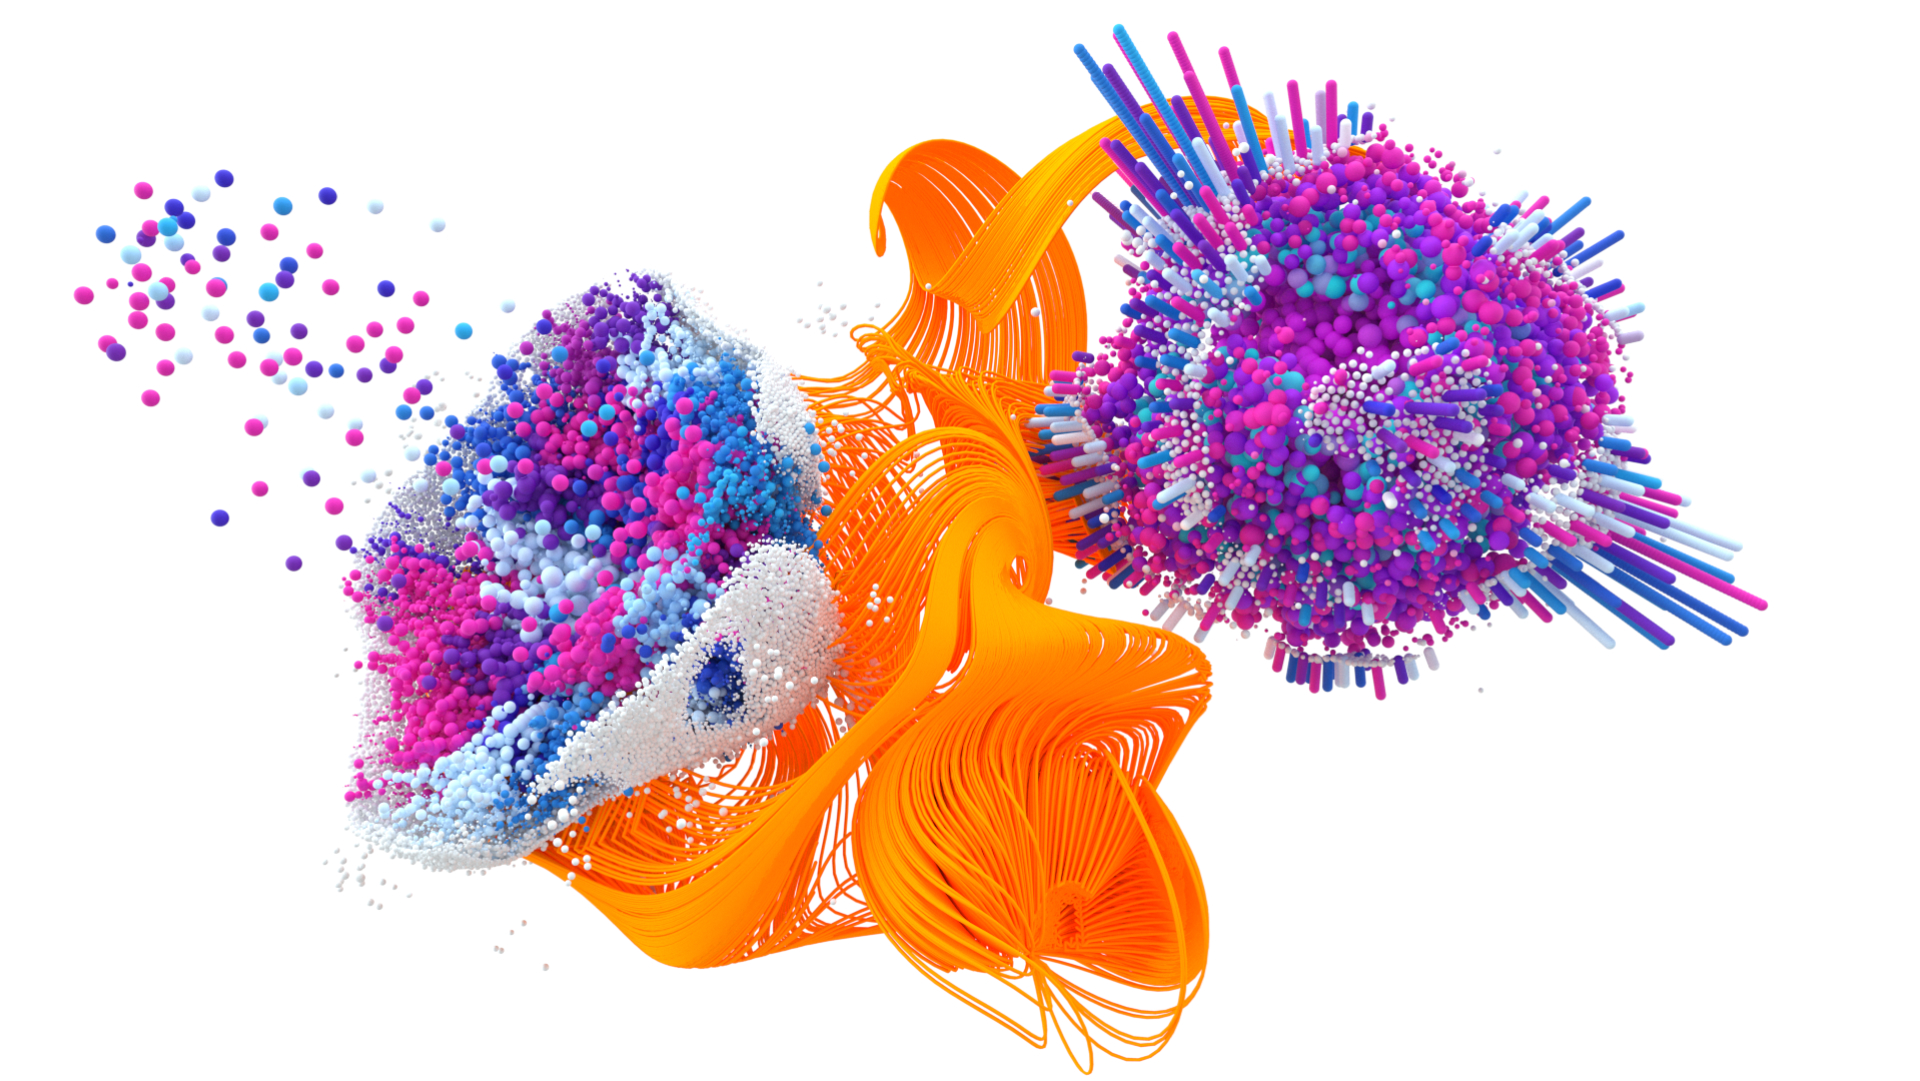
Data planets
Whilst working on the composition of the final images we decided that each technology could be its own discrete data planet, each with their own distinguishing identity reflective of their unique systems. Despite being different technolgies however the planets were largely concerned with the same genetic data, we reflected this by keeping the data particles and colors the same, inspired by the genetic data they visualised.
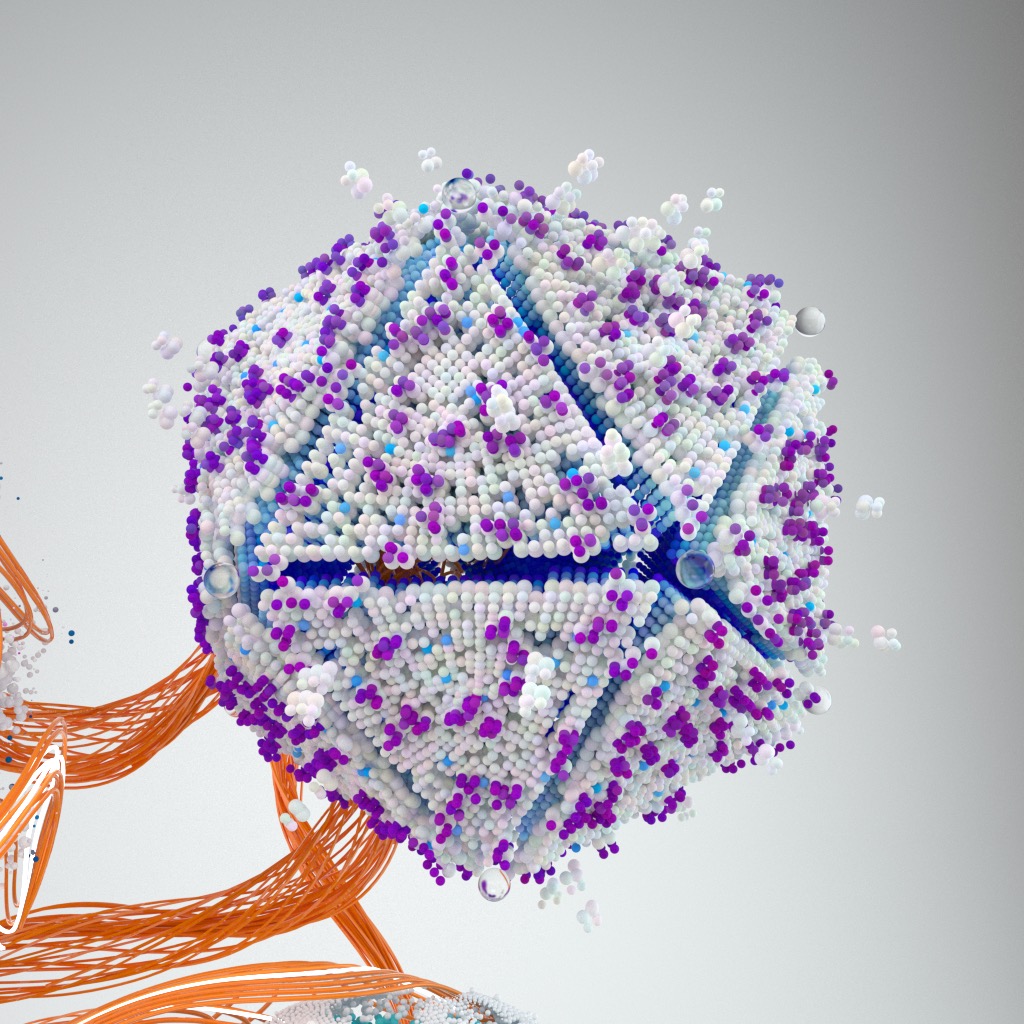
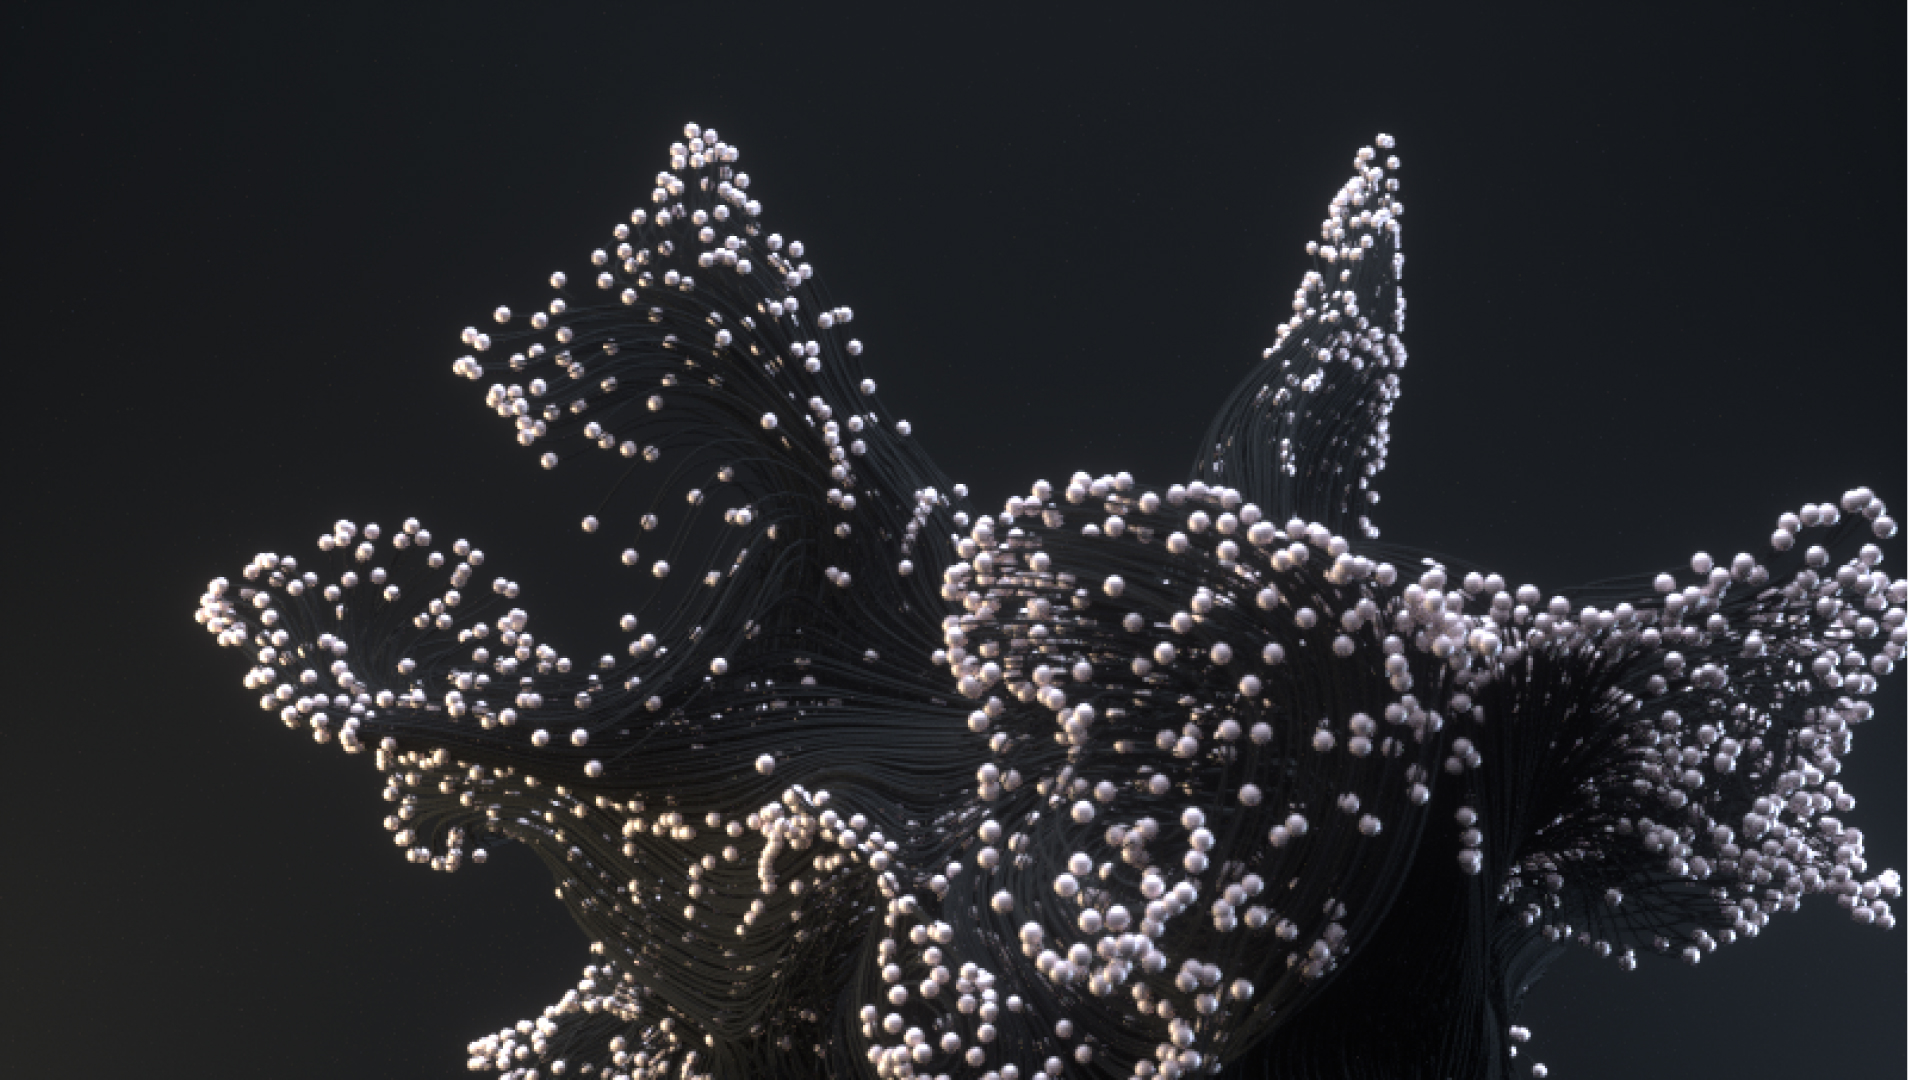
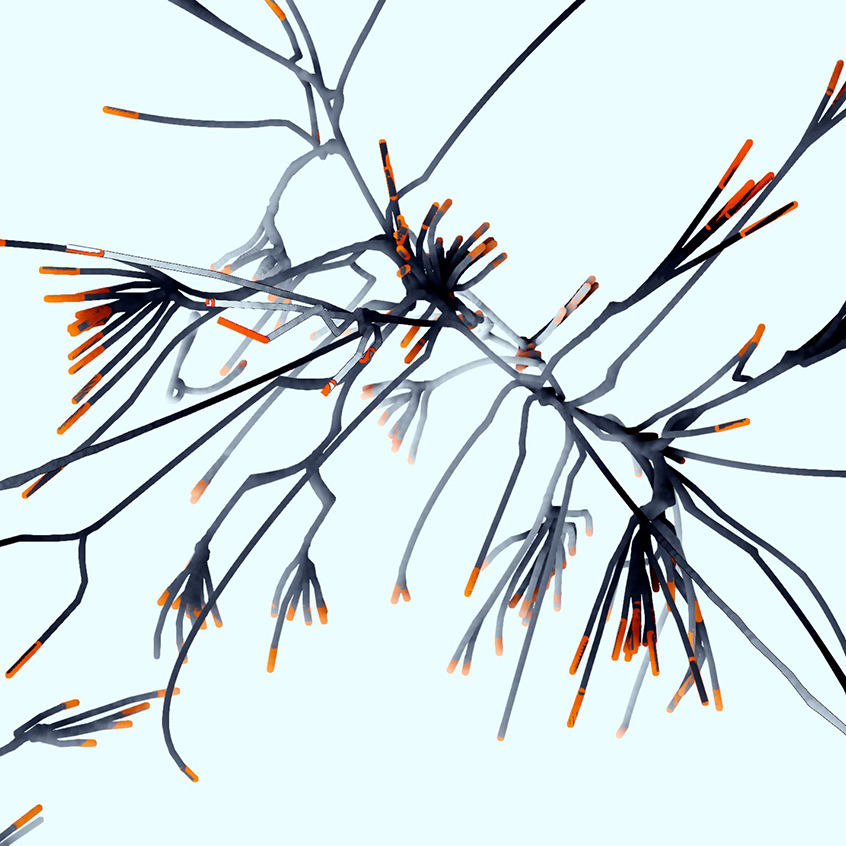
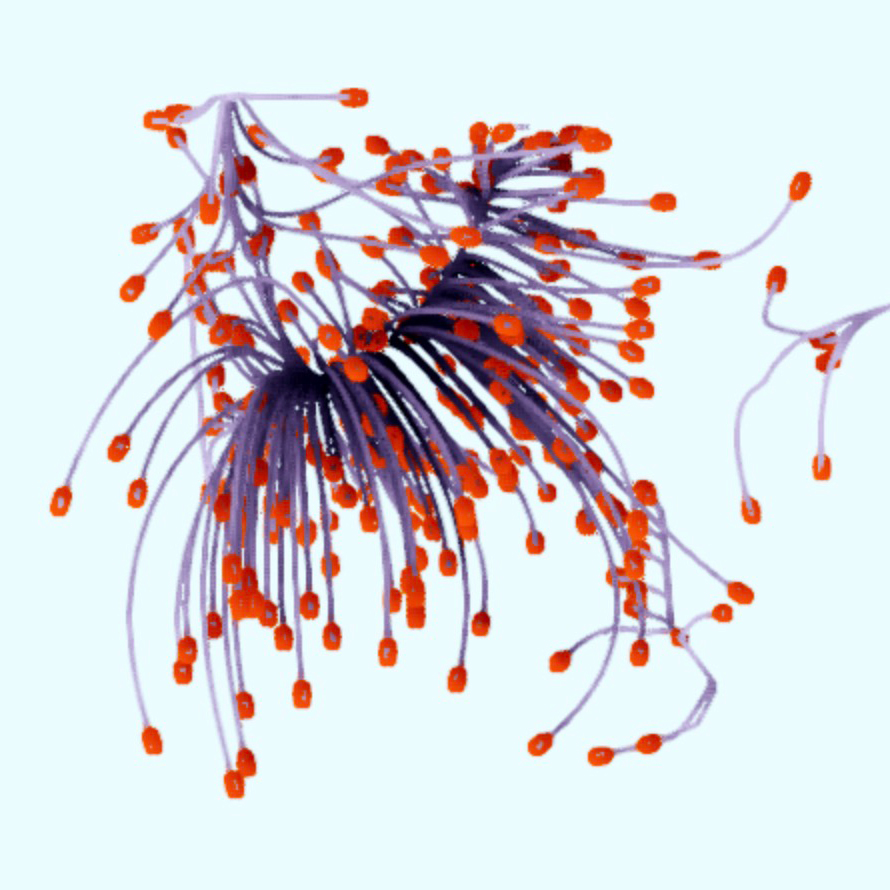
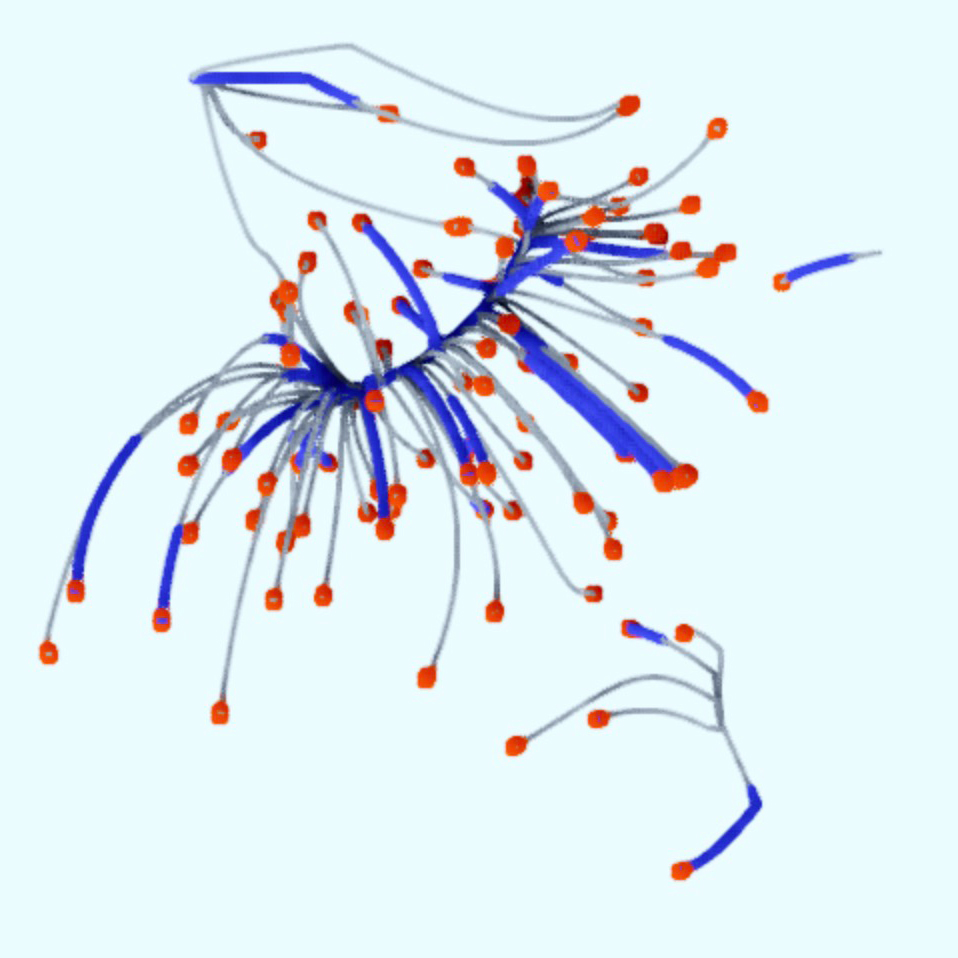
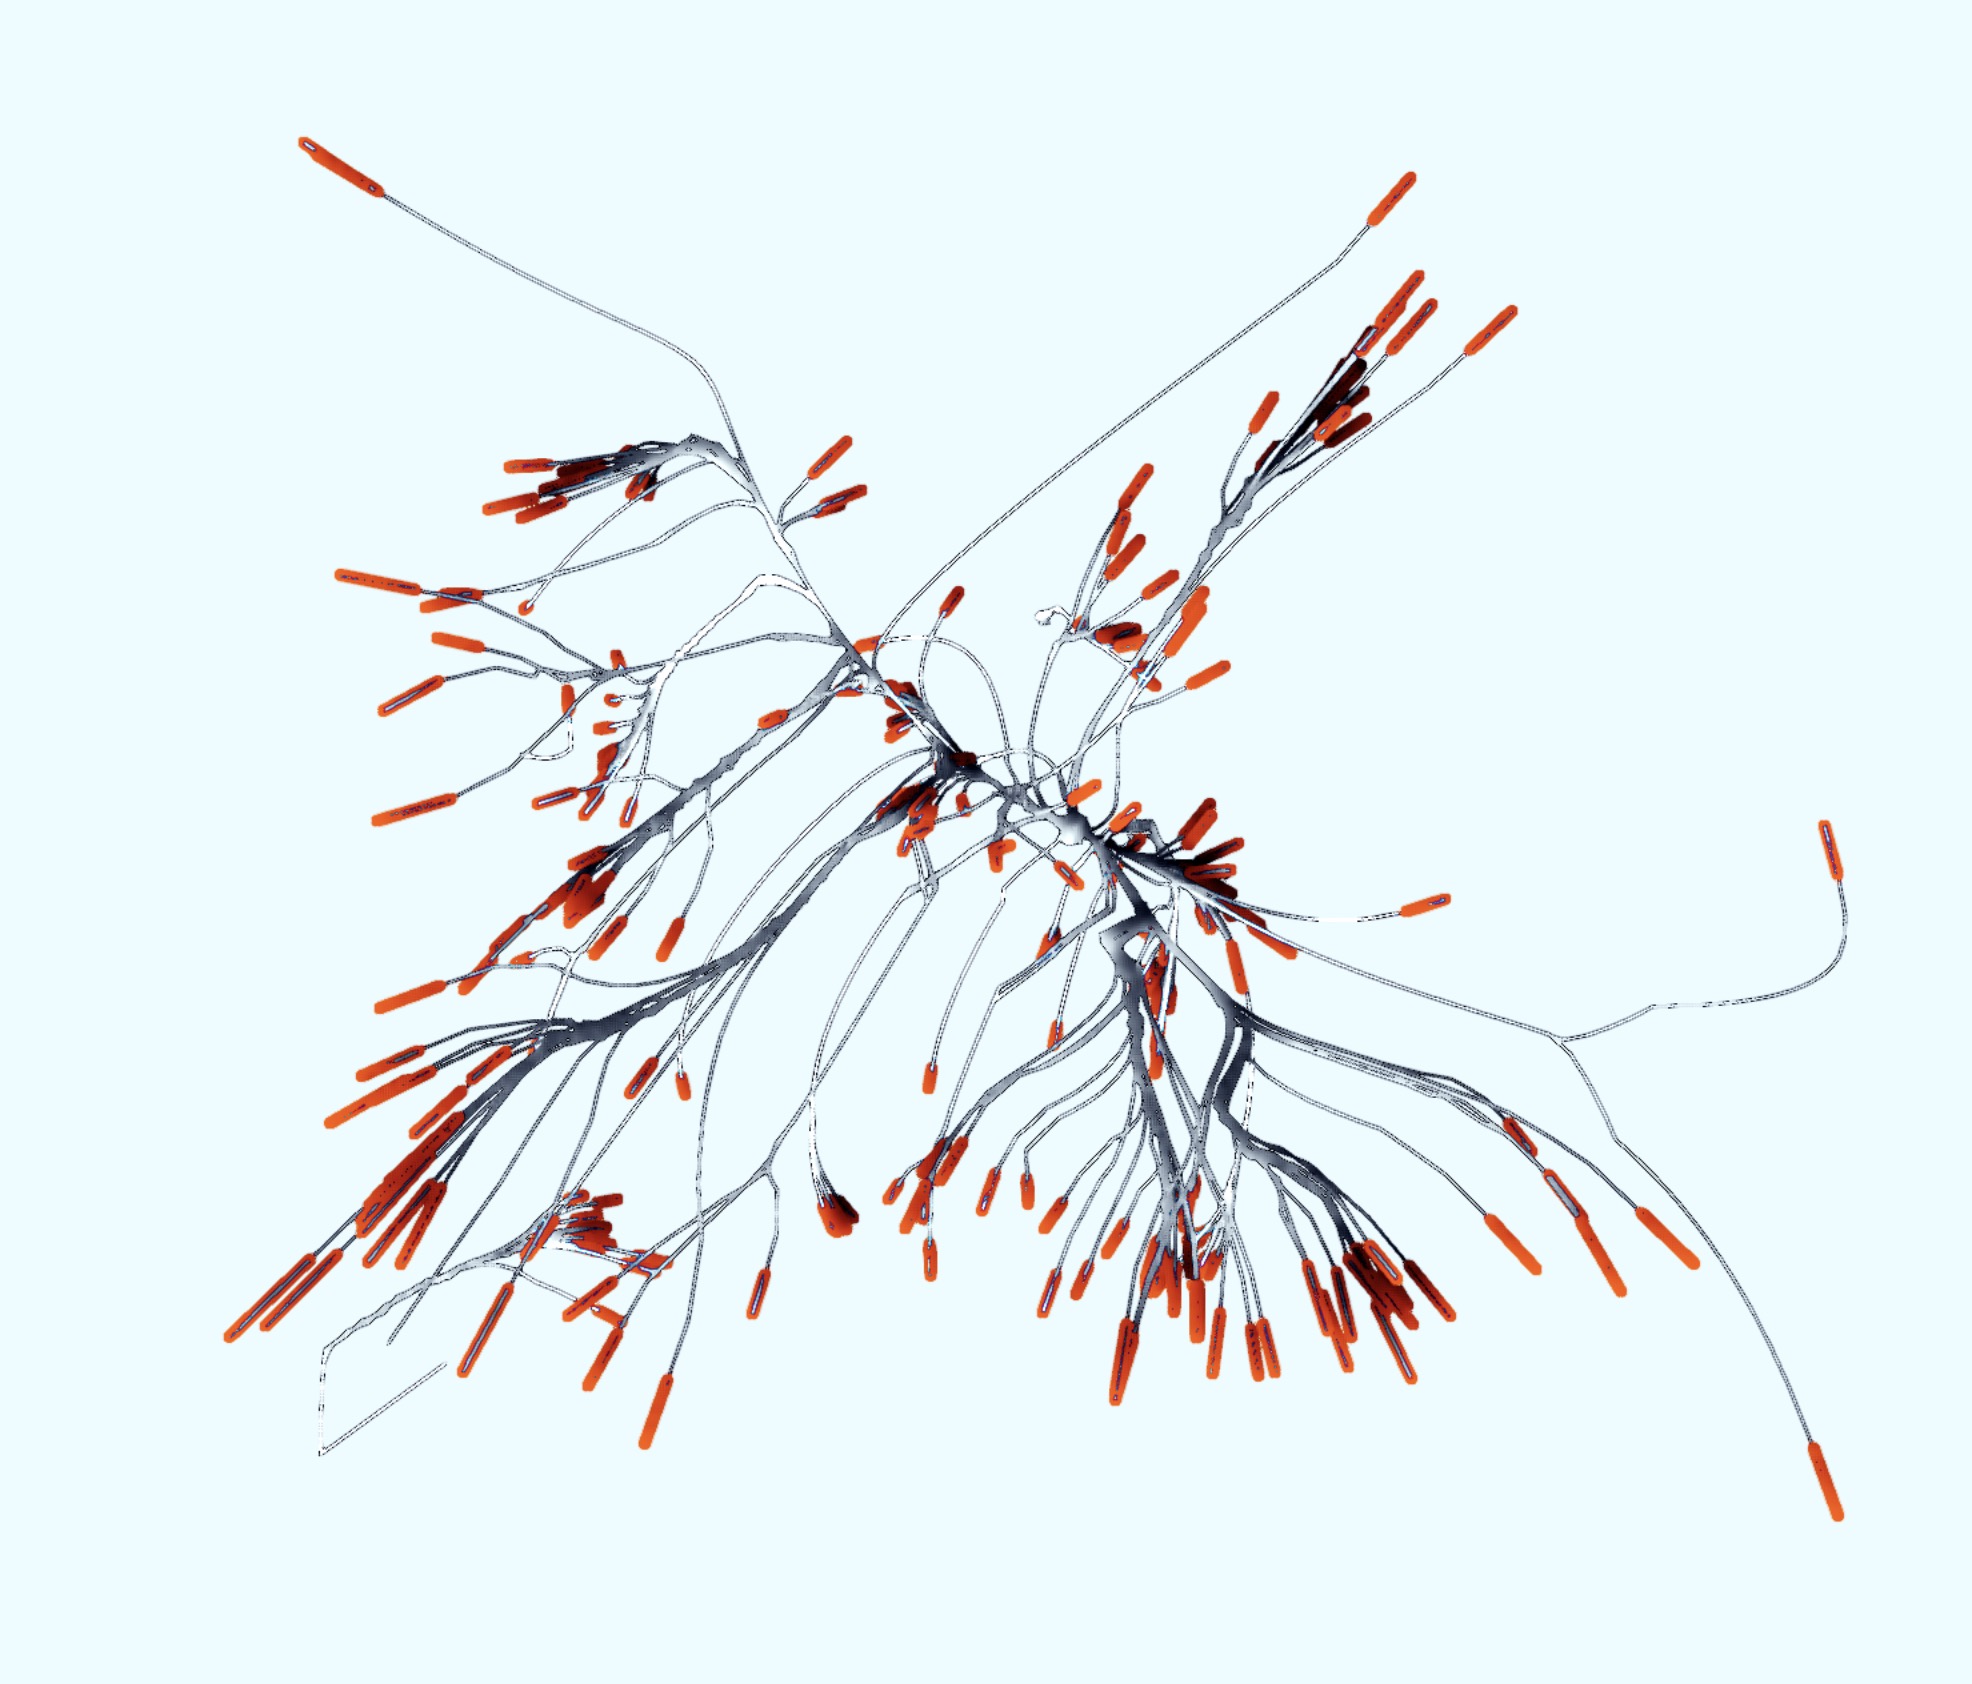
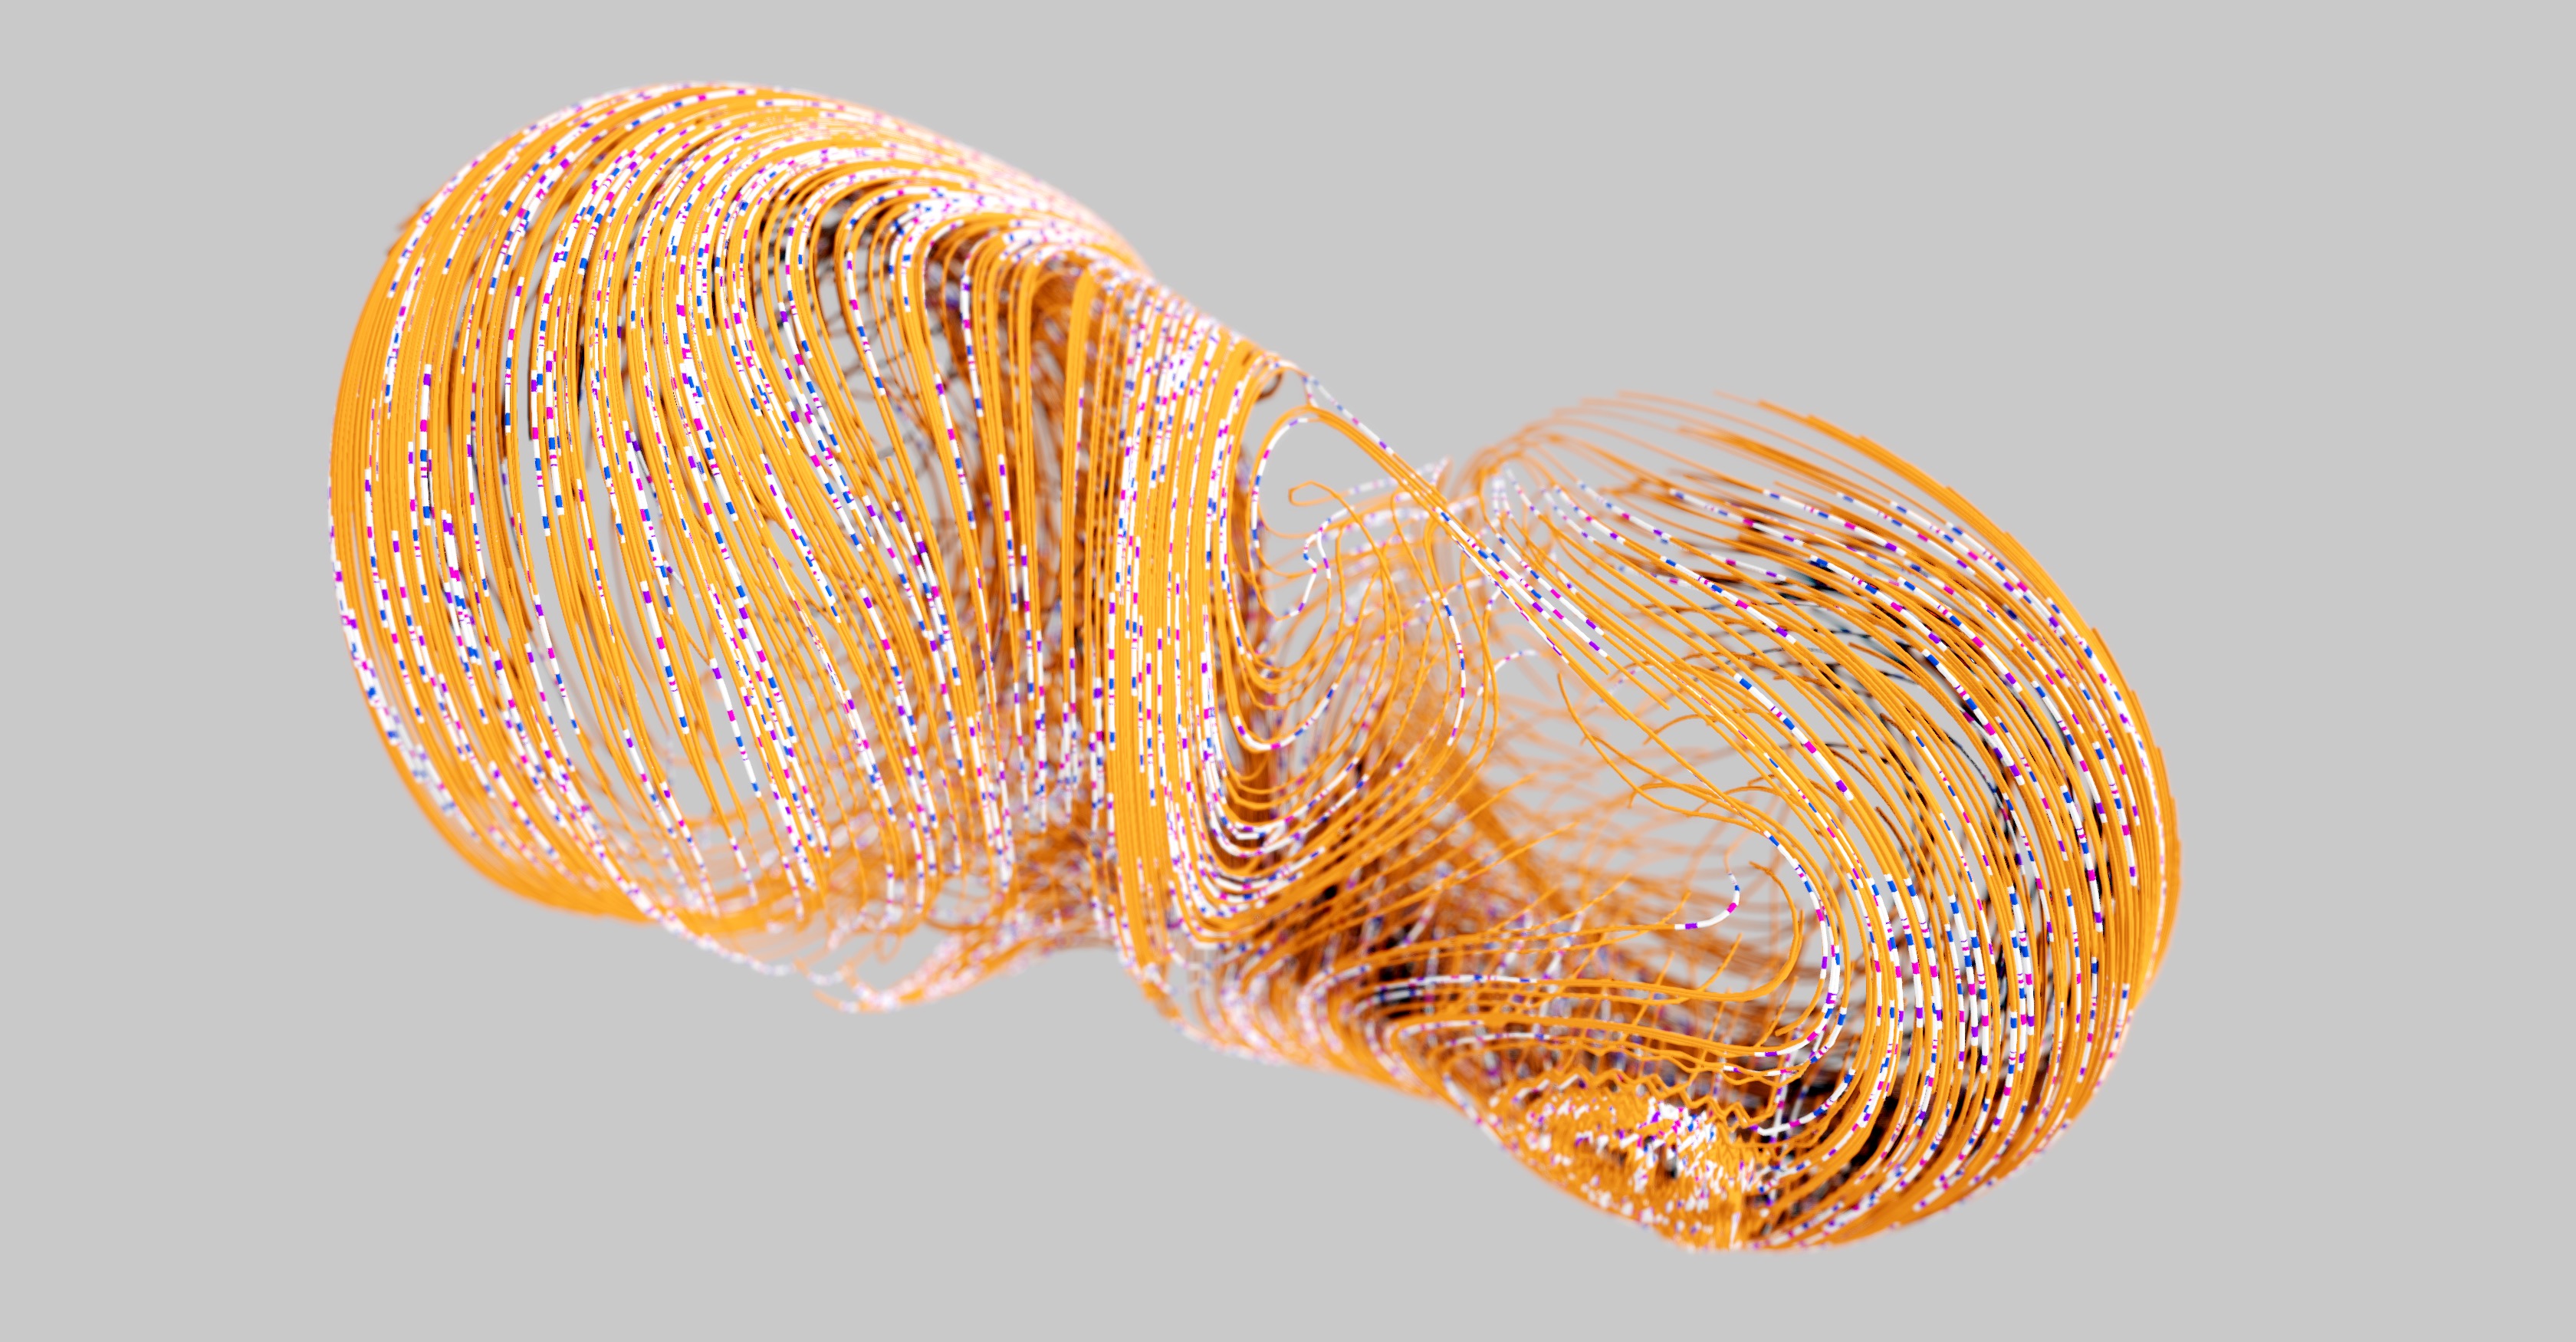
Neural networks
The final unifying factor in the image was the networks between the technologies. This shape evolved the most as our understanding of the use of machine learning and the movement of data between technologies became more complete. Originally proposed to show the flow of data between technologies to a discrete 'machine learning planet' the concept of 'threads' changed as it became clear machine learning is uniquitous within all the technologies we were visualisitng. To reflect this change the networks became its own shape with distinctive form and properties of its own, while also acting as a bridge between our technology planets.
The use of SideFX Houdini
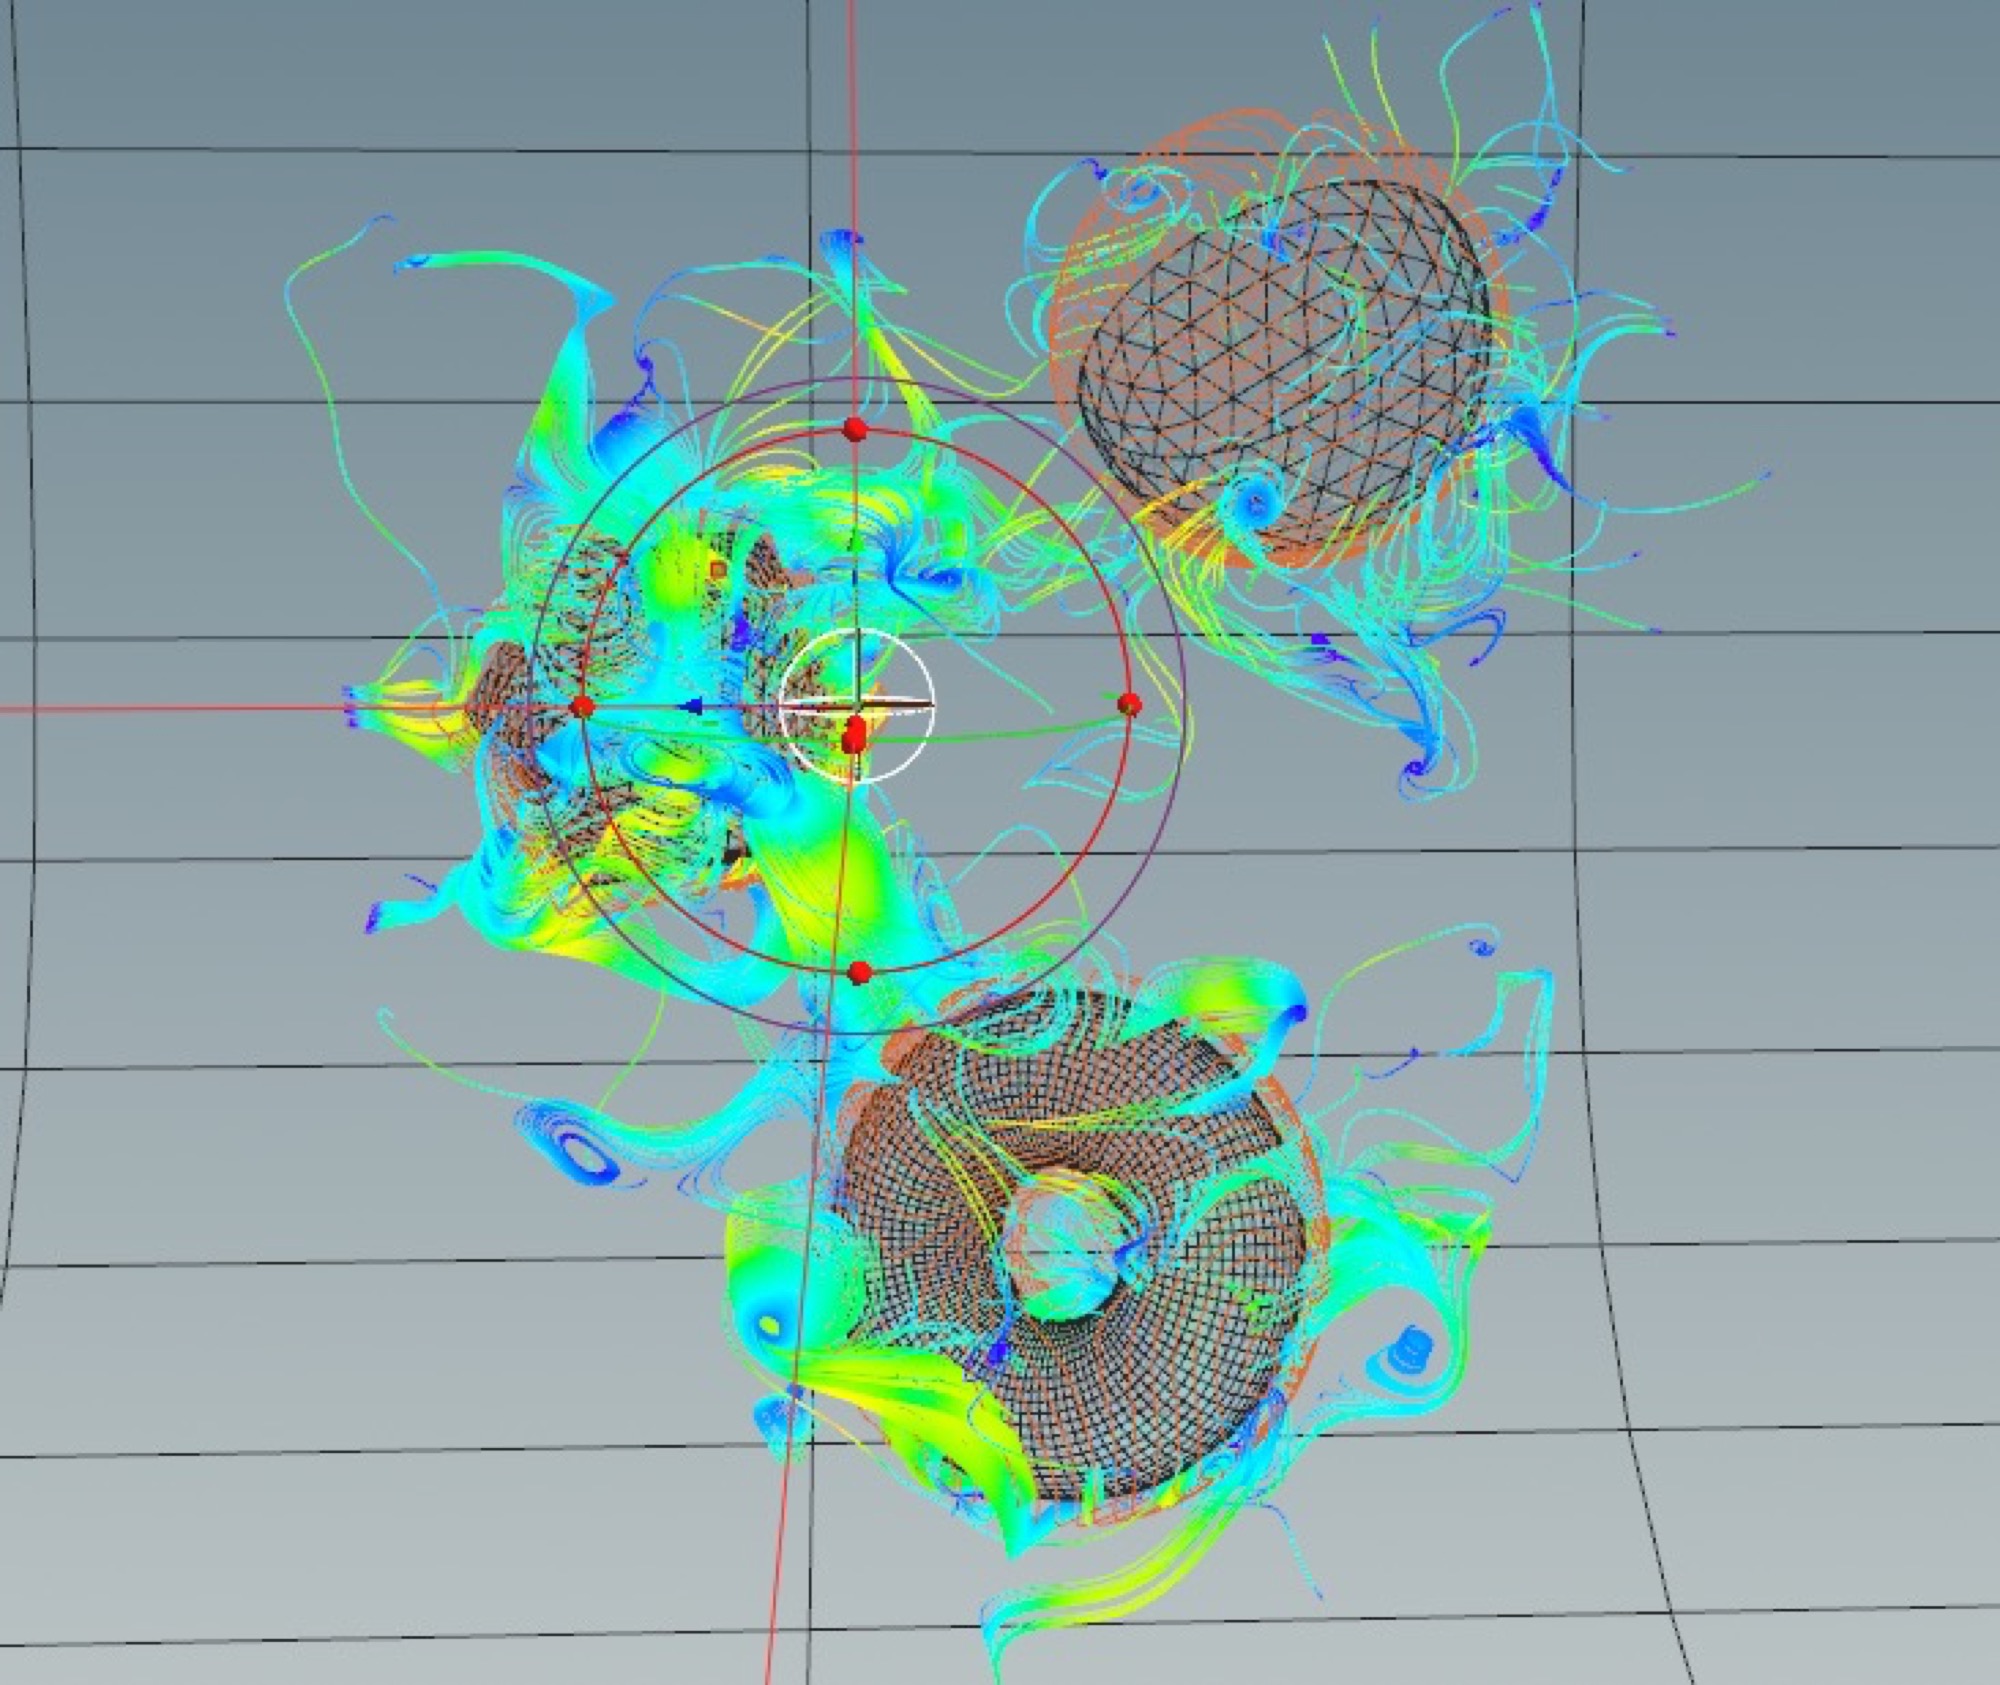
Houdini turned out to be very useful for algorythm prototyping, and allowed is to quickly iterate on complex systems that wouldve been impossible for an individual to manually make in the timeframe. When we had an idea of the kind of shapes and motion we desired, Houdini allowed us to run complex simulations in a way that was customisable and parametric using systems like custom vector flow fields and particle systems with realistic collisions.
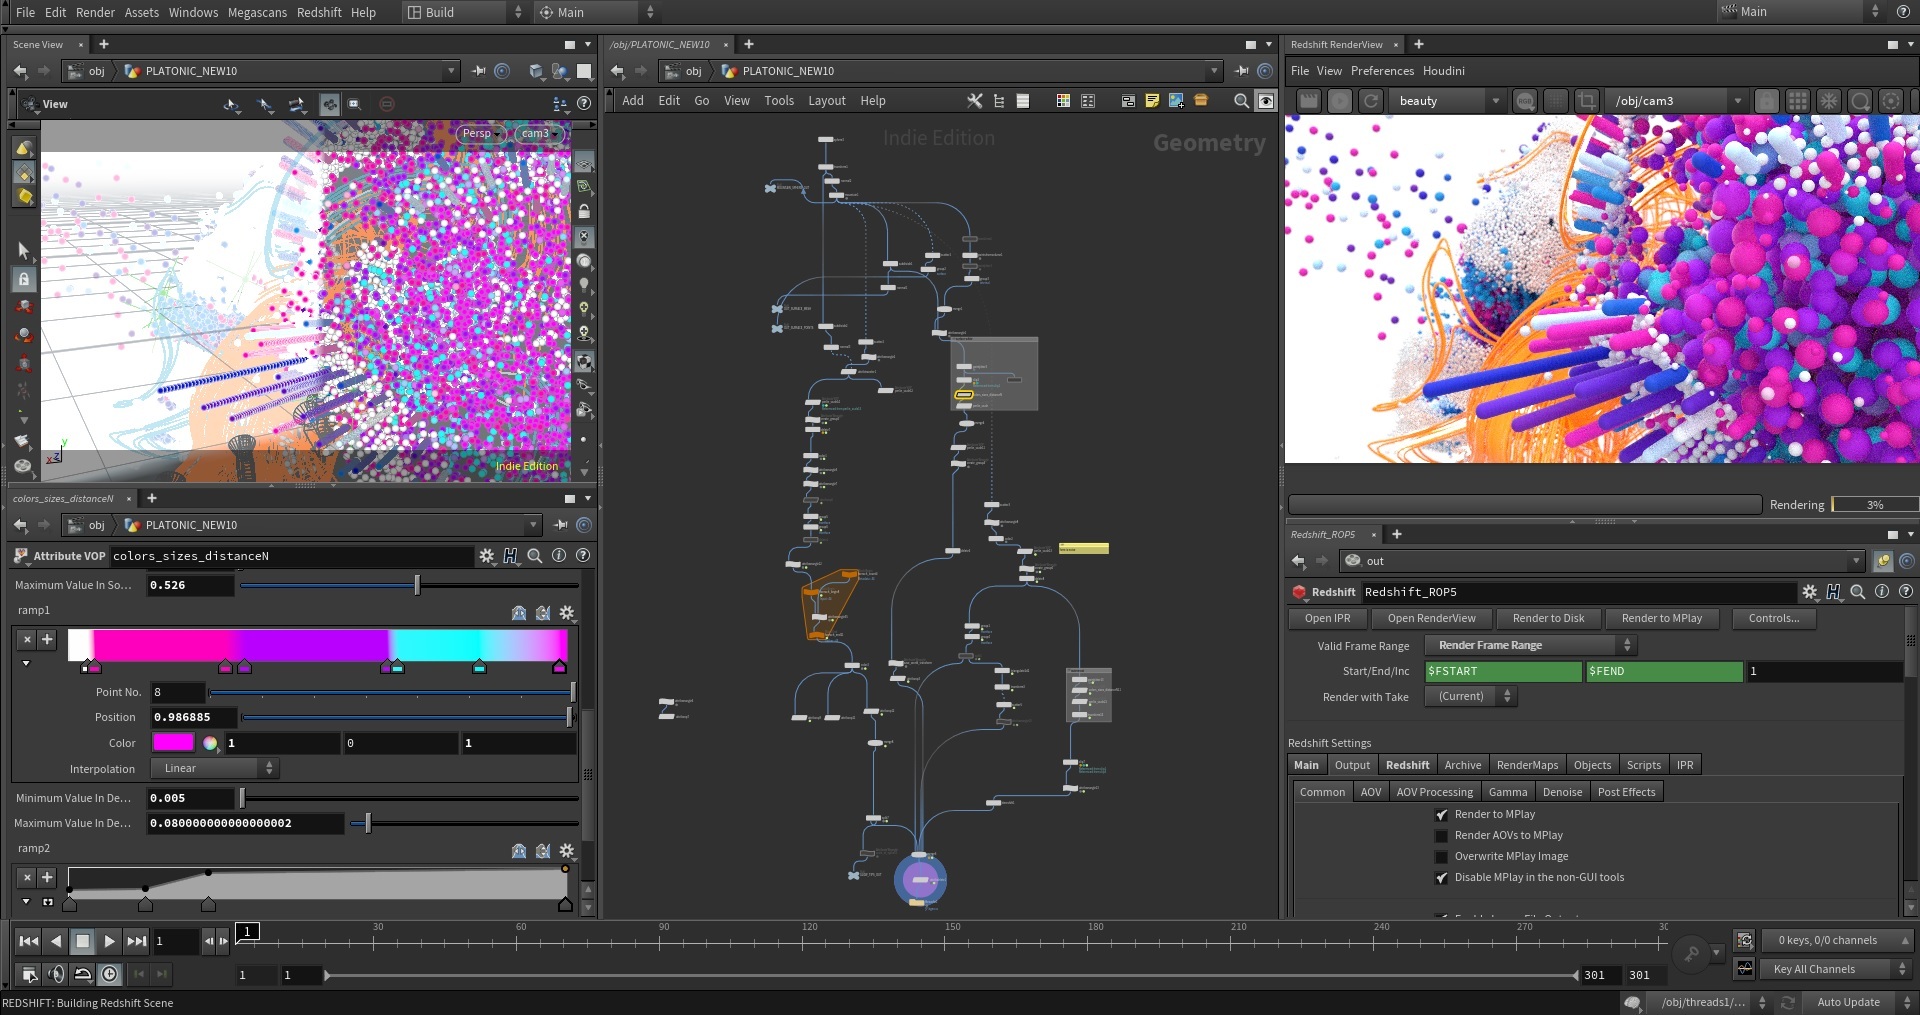
Due to the aesthetics of the project being clean and bright we decided that the final images with be rendered using Redshift, within Houdini. The biggest downside to pathtracing images is that it is very time consuming compared to realtime alternatives. To combat this we built a Houdini to Nodes.io workflow where the geometry from Houdini could be rendered in realtime and colors/shaders and general feel could be experimented with. These shaders could then be replicated in Redshift material networks and tweaked for the exact look required under the pathtraced lighting conditions.
This combined realtime / pathtraced workflow was paramound in bringing the art to life and with quick iteration and experimentation.
Next
See also
Are you interested in representing your data in a new way? Learn more about Generative and Data Driven Art, Data Visualisation R&D, or contact us and say hello.


