This is the first case study for our project GSK - Visualising Advanced Technology
Introduction
In December 2019 we were approached by London agency WeLaunch because they had a unique and complex design problem that we were well suited to tackle:
"How do you visualise and communicate the role of advanced technology within the modern drug development process."
The project was for a pharmaceutical company with over 12000 people working in research and development across 3 global businesses with £4.3B adjusted investment in 2019. The role of advanced technology is key to that research, especially with the rise of AI & Machine Learning techniques.
The goal was to try and communicate some of the more complex systems within the company with a specific focus on how big data and machine learning have become ubiquitous in the drug development process, especially in the context of genetics and functional genomics.
Scope
This was a large project, from conception to delivery being about 10 months with many intermediate deliverables. We often had many concurrent conceptual threads running at the same time, diverging and coming back together as we learned more. The first major part of this project was building the visual frame that we wanted to use in the composition of the final piece. The goal was building a system that would suit this work but also extend beyond it as they wanted to introduce new technologies into their advertising landscape

Scale
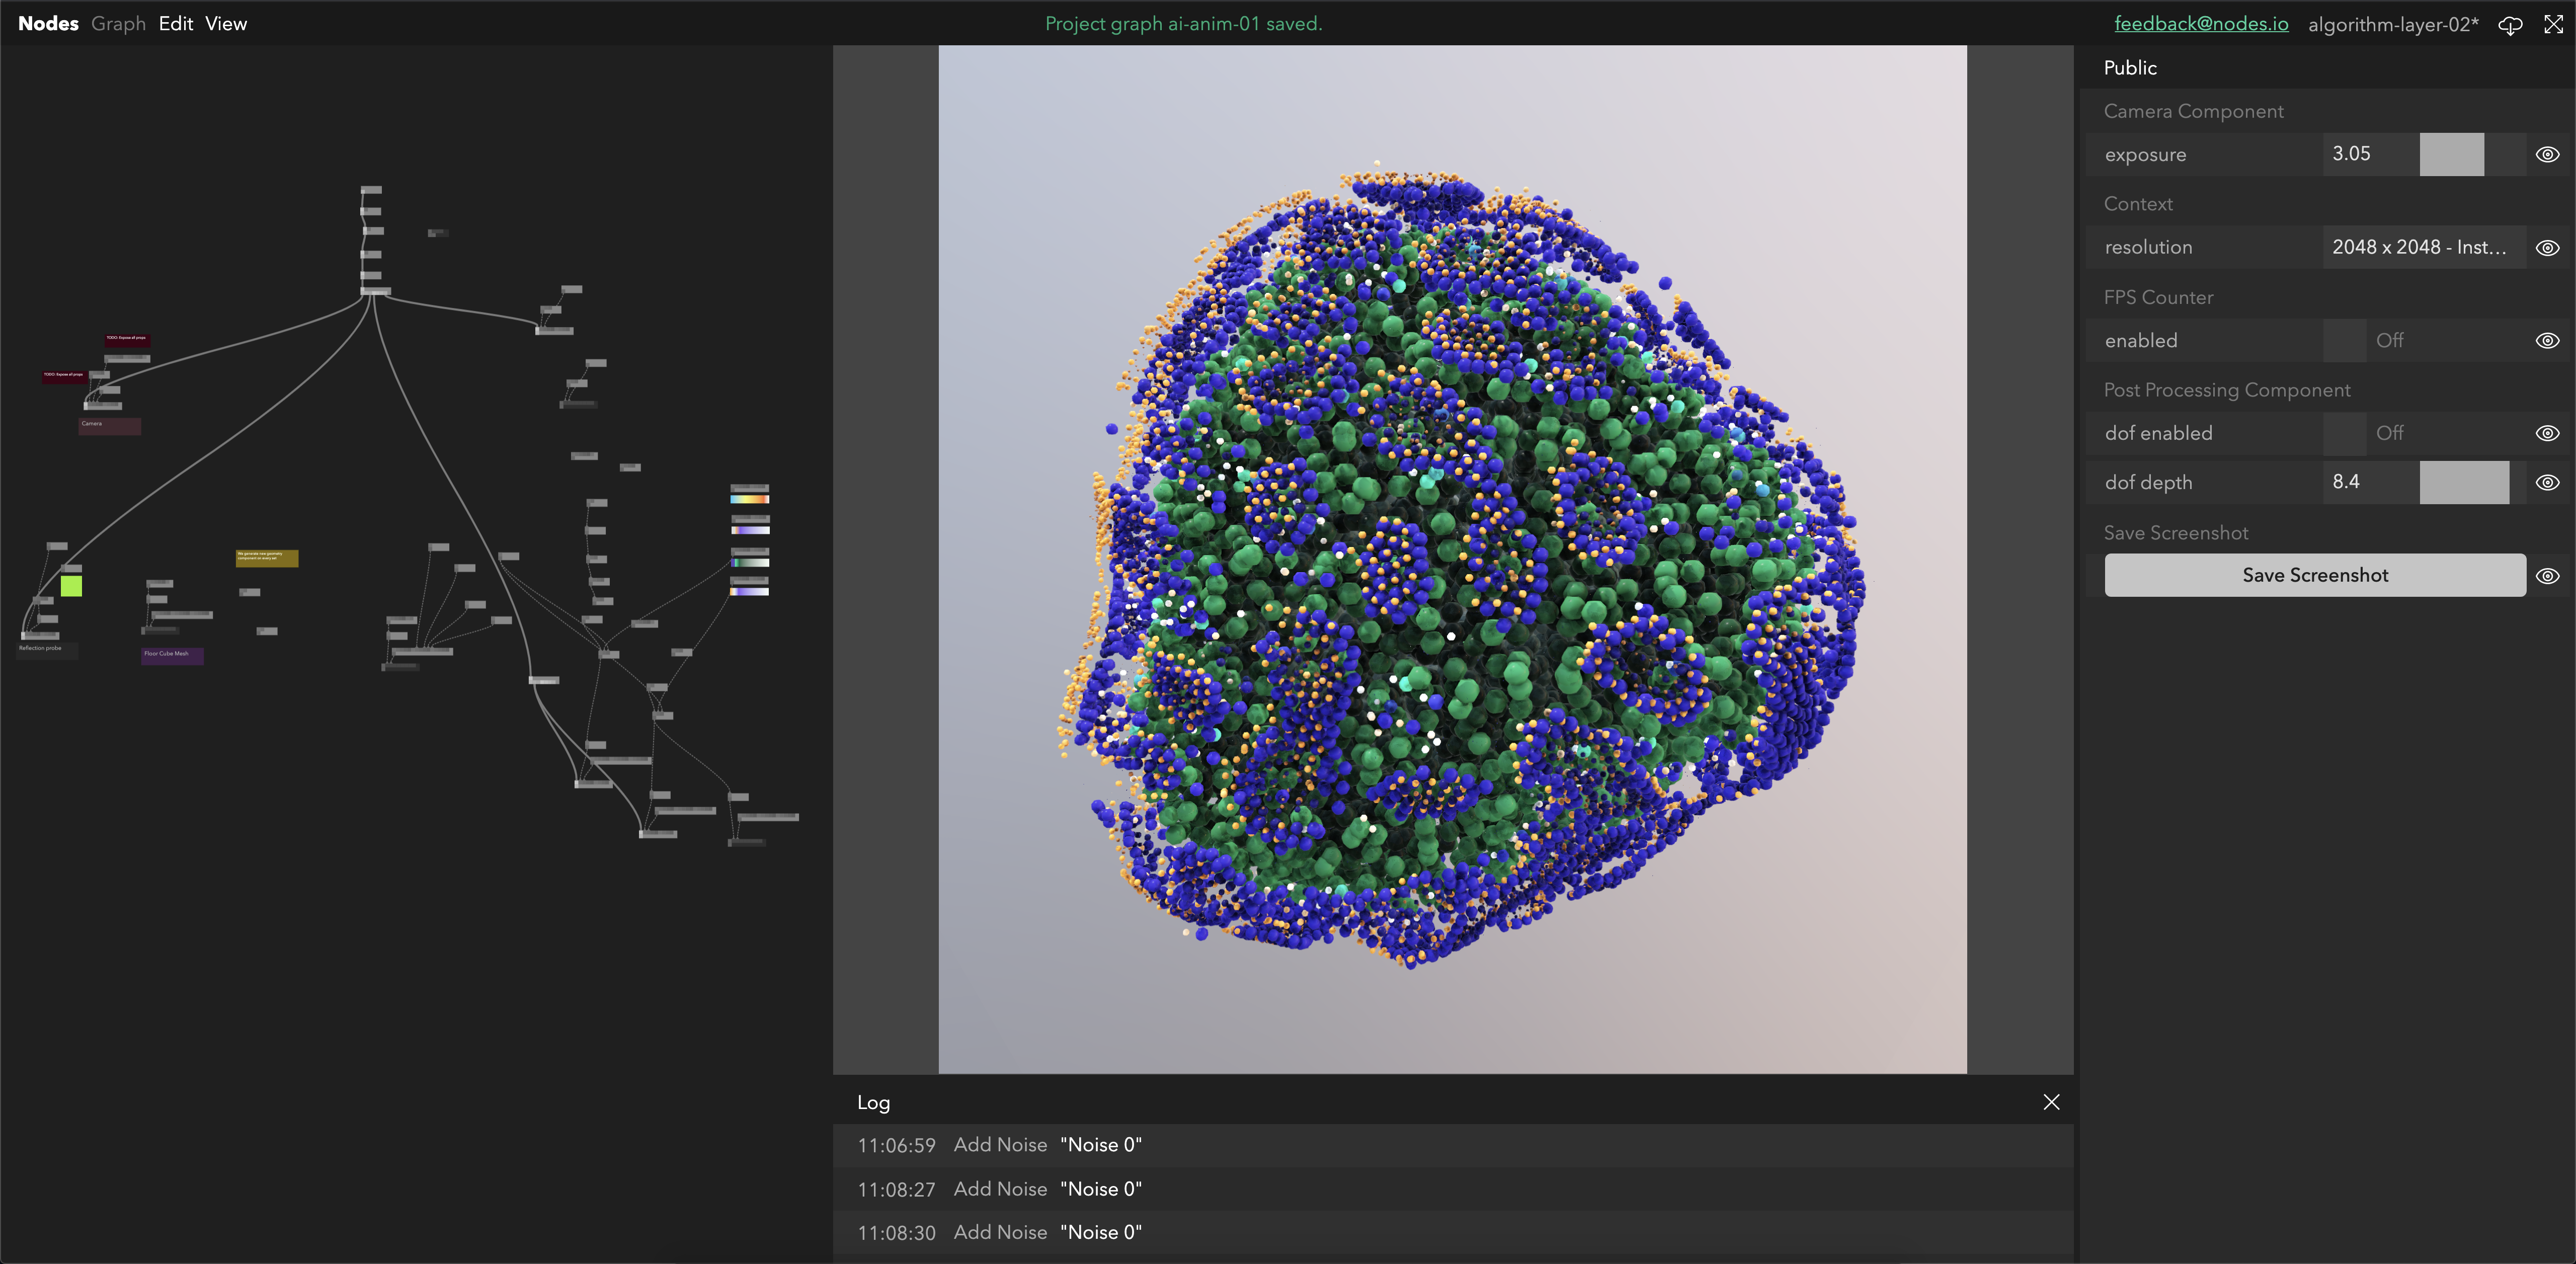
The output for this project was large, even considering the timescale. Adoption of new technology, the use of Nodes for prototyping, and collaborative thinking canvases empowered us for fast iteration throughout. Remote working tools such as Google Slides for presentations and Figma for a collaborative thinking canvas were of high value throughout

Understanding the process
Our first step when approaching projects like this is to ensure we understand the systems and processes involved in what we are visualising.
The aim of this process is to extract the stories that resonate within the system we are communicating. If we can find the links that connect the subject areas we can create a story and visual language that has coherence. We went though many iterations of this process, learning from representatives from the company and doing our own research.
We were fortunate to have team members at Variable with specialised backgrounds like Pharmacy and Computer Science to help navigate the terminology and understand the processes described. This was a particularly intense research phase, partly due the complexity of the topics being discussed, but also the secrecy surrounding a lot of the research here.

The outcome of our research was a process diagram explaining how data flows through internal systems to assist in discovery of new drug targets, developing new drugs and in result helping patients.
That diagram allowed us to communicate the advanced topics like Genetics and Functional Genomics using small set of understandable common terms which the average person could read and understand, while remaining scientifically accurate.

Understanding the data
Once we understand the systems that we are visualising it is time to have a look at any data the client could offer us or we can find, which we then use to ground the generative images in reality.
Reverse Genetics Data
In a Reverse Genetics experiment a cell is treated with a potential drug, and two genes from that cell are removed. This experiment is a good example of modern drug research as it uses the powers of technology like CRISPR to find links between drugs and genes on a large scale.
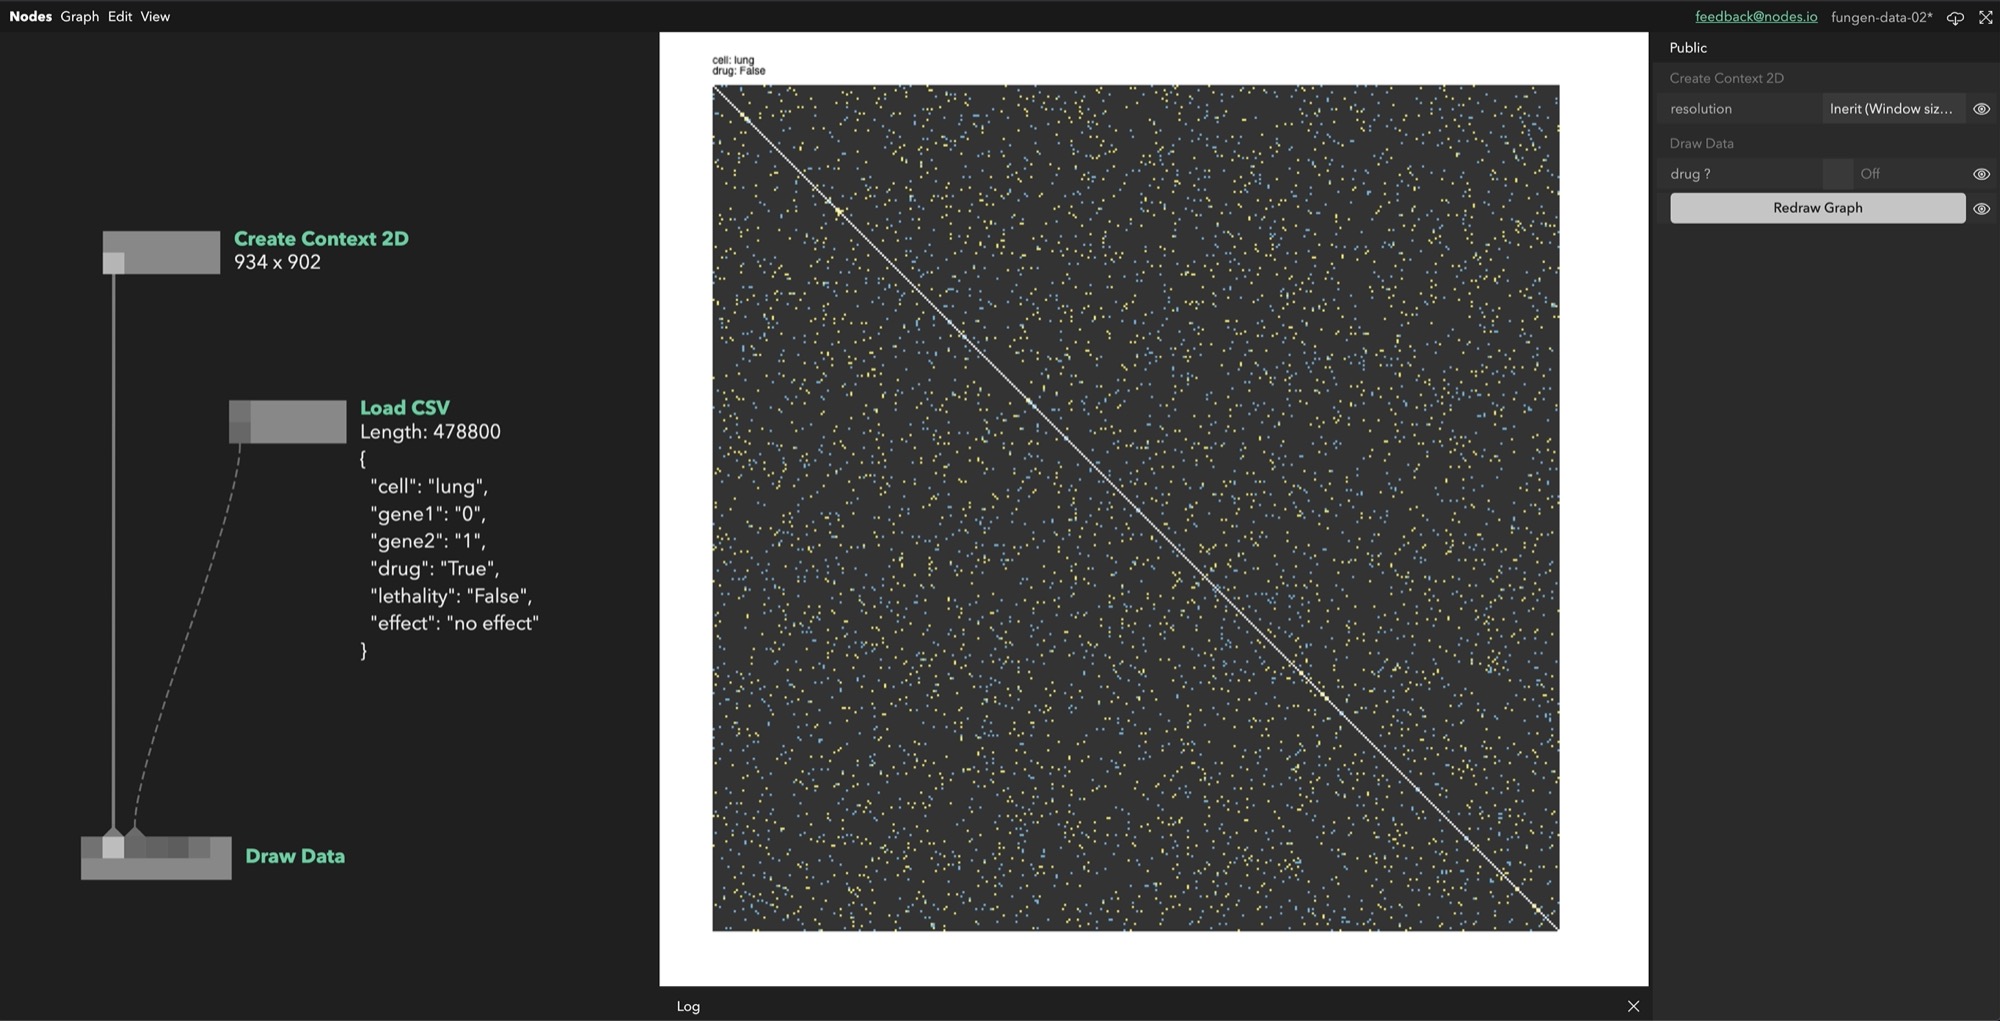
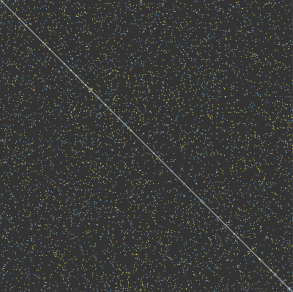
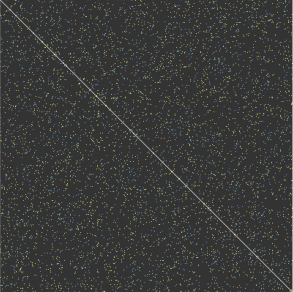
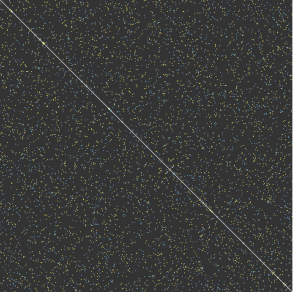
We visualise these in grids of responsiveness, which we can used to inspire and influence the final designs as well as using the forms directly in early prototypes.
Open Access Cancer Data
Open access cancer data showed the link between gene mutations and types of cancer. Using our internal tool Nodes we explored the data through a series of visualisations and dimensionality reduction algorithms like t-SNE in order to inform our data stories.


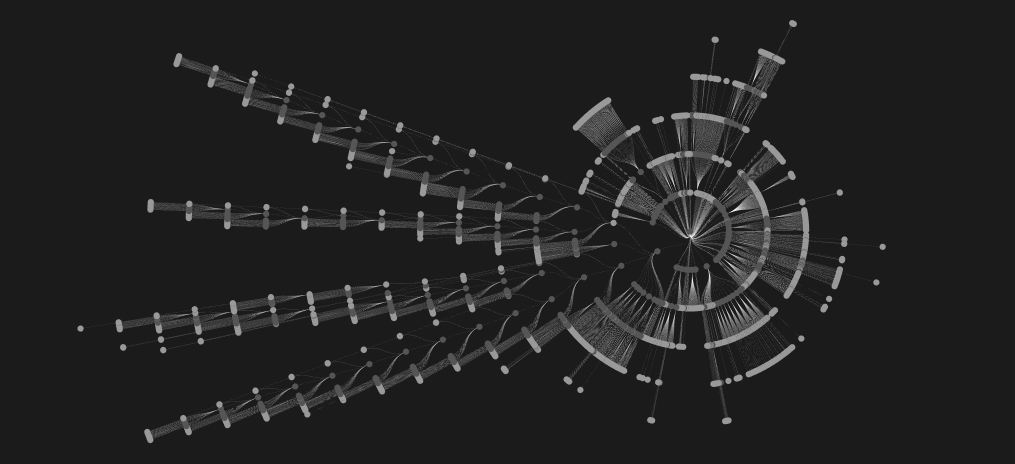
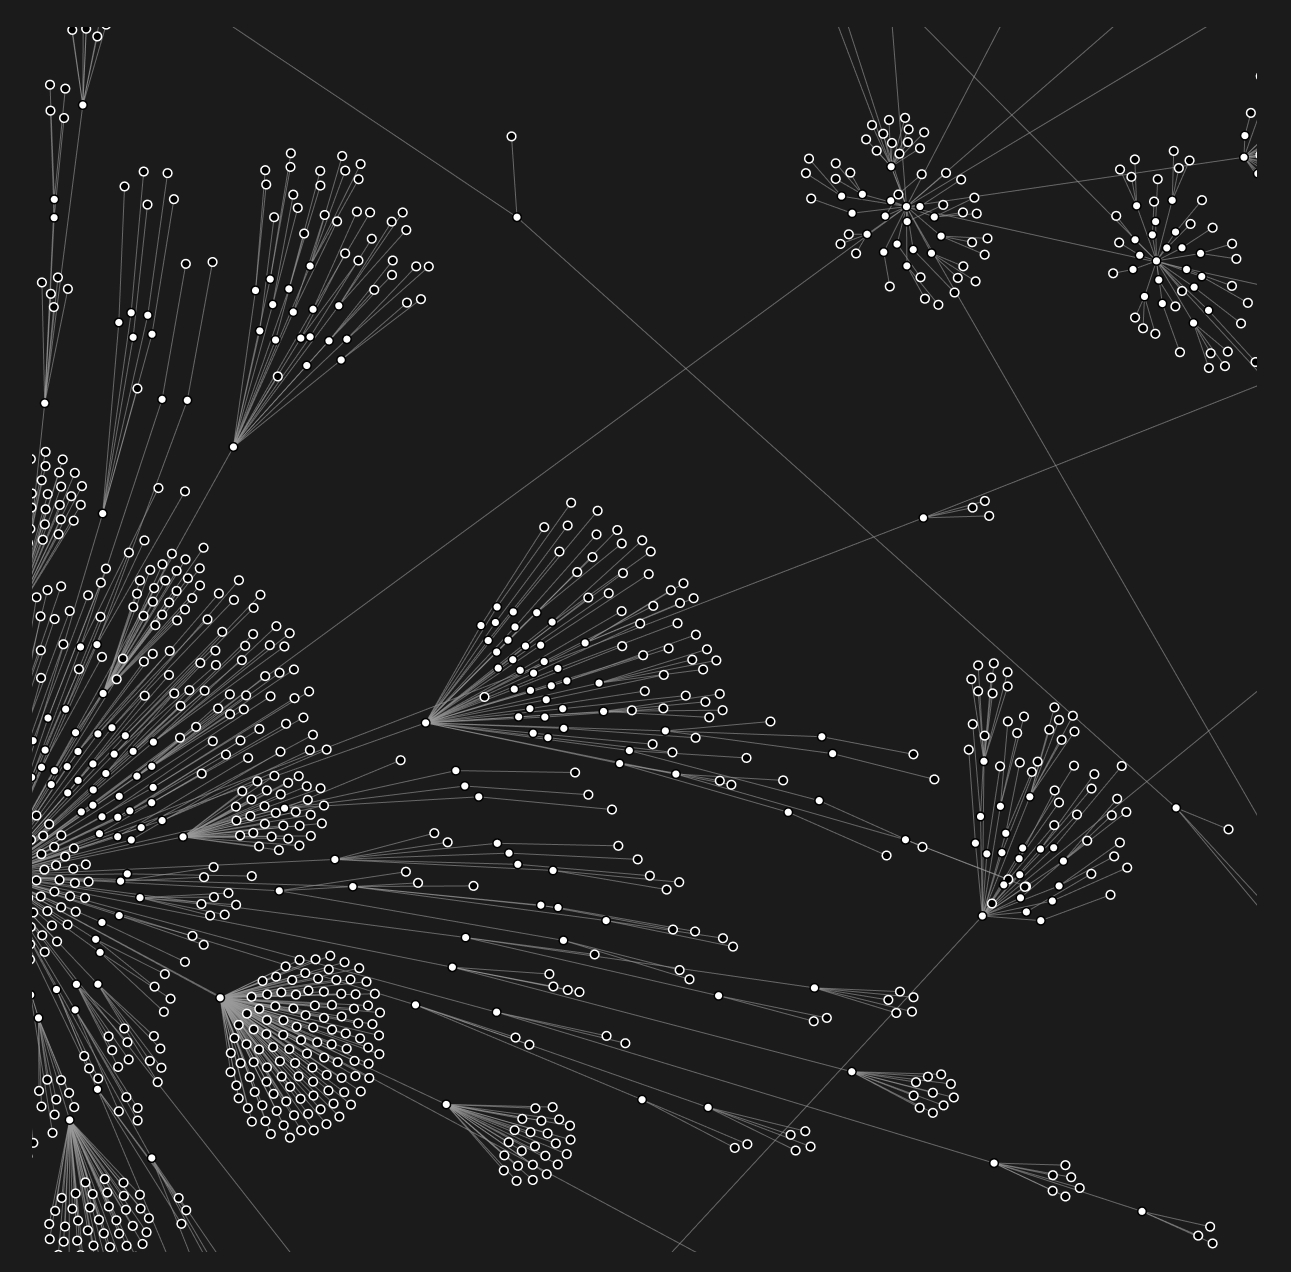
Website visualisation
As conceptually we are visualising some of the internal structures of GSK we thought a great way to inspire the shape of the visualisations was to use the structure of the website as an abstract representation of GSK itself. Again using Nodes we were able to make these beautiful organic forms from the sitemaps.

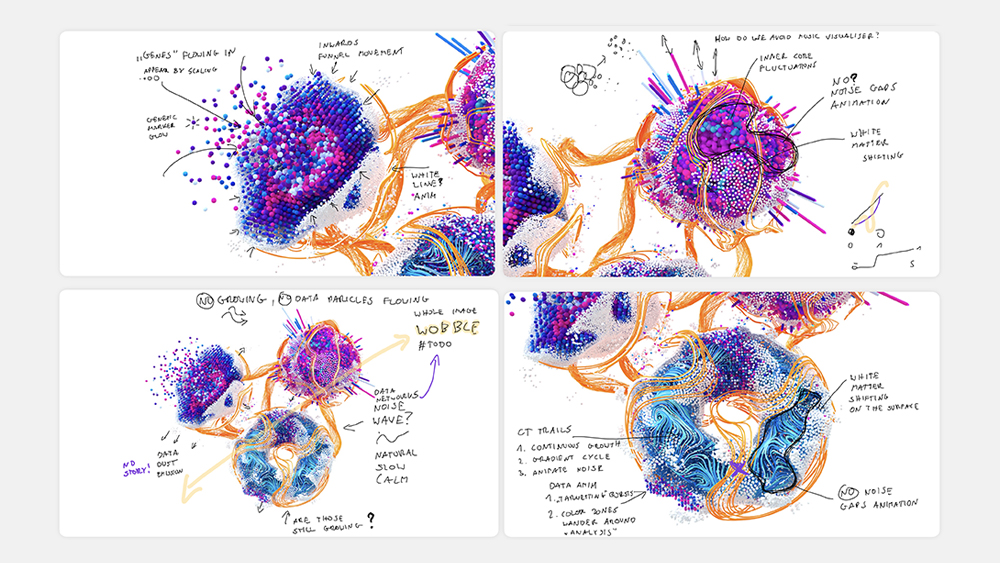
Our proposal
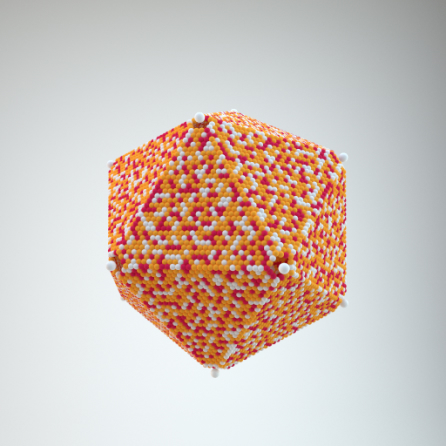
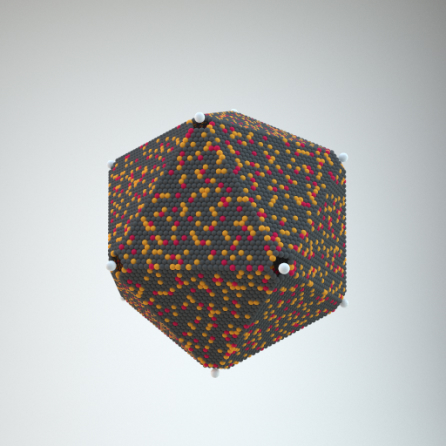
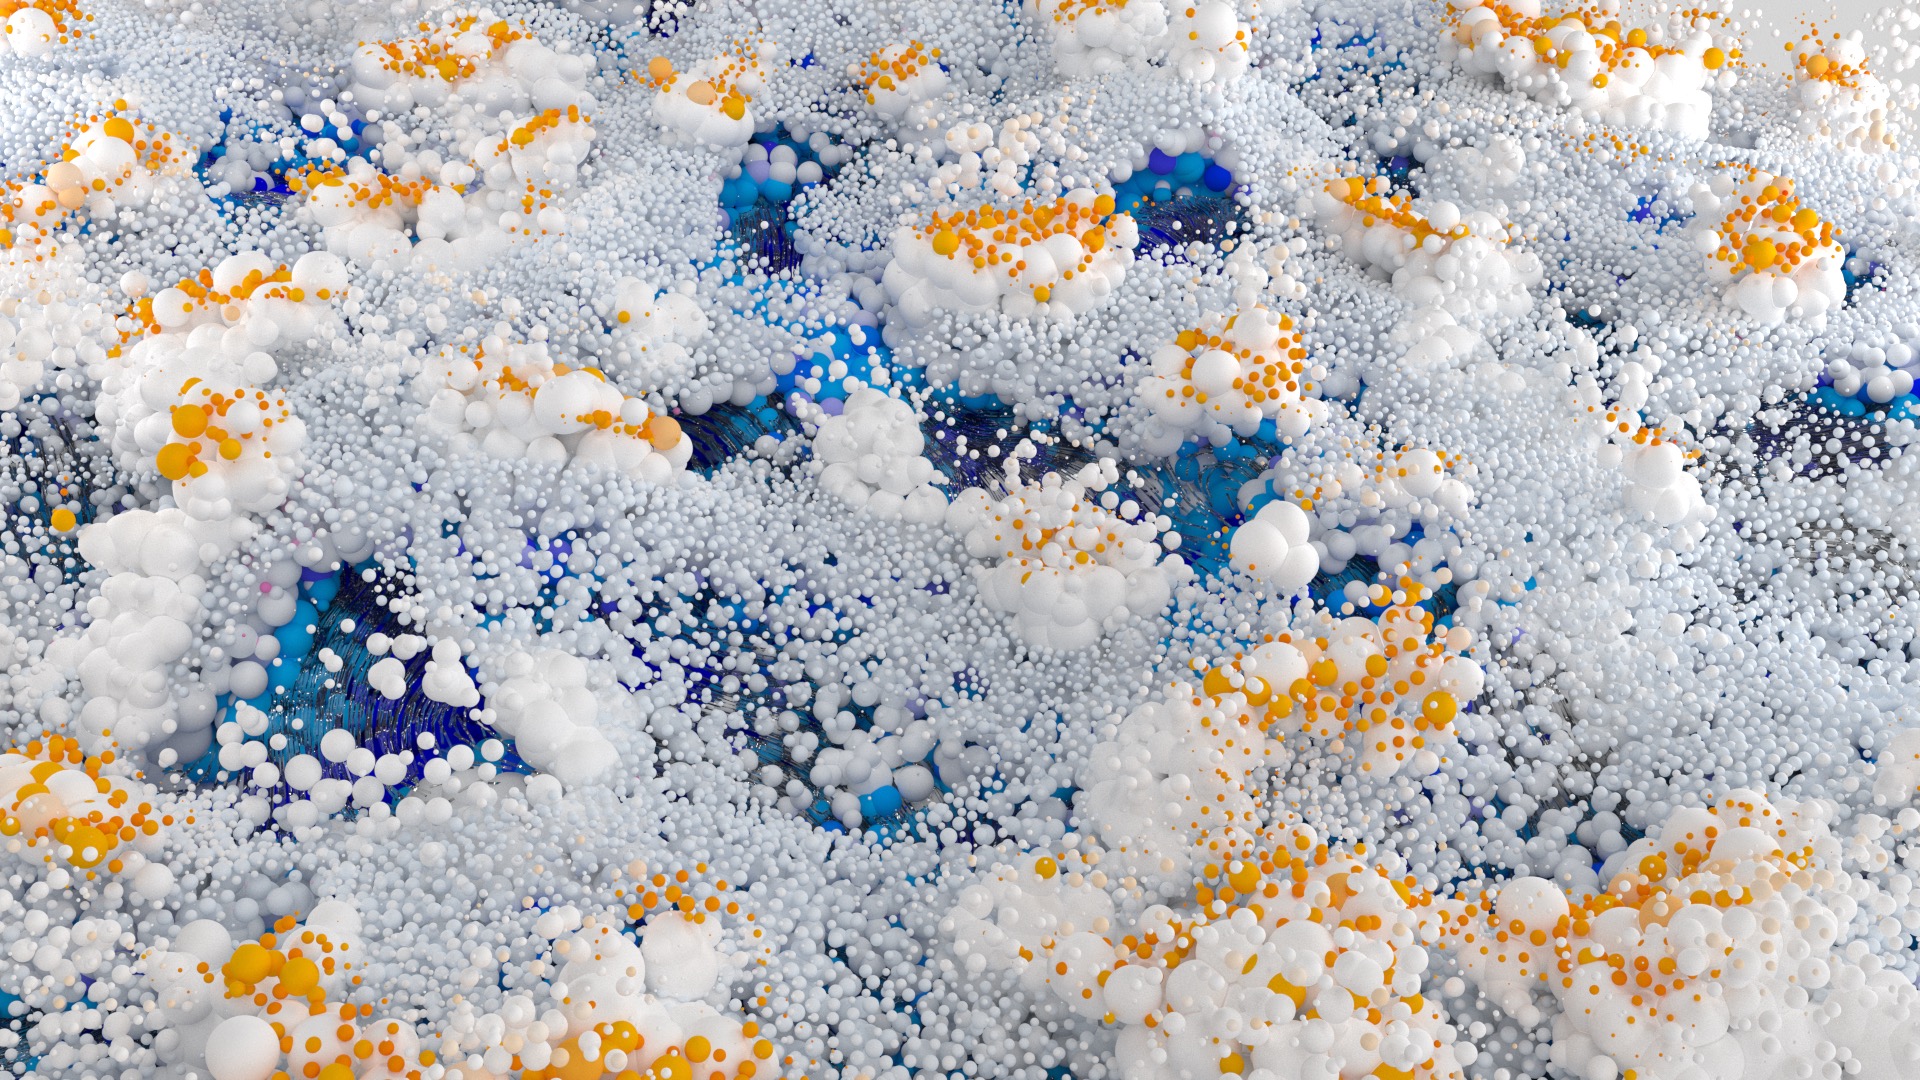
Once we had a view of the data we could work with the system itself we started considering how we could tell these stories. As data was at the heart of all of the technologies at GSK with each technology working together our final proposal was:
Technology planets with an algorythmic surface processing data at the core. All this bound together with an interplanetary highway of machine learning networks, as omnipresent as it is in the process itself.
See also
Are you interested in representing your data in a new way? Learn more about Generative and Data Driven Art, Data Visualisation R&D, or contact us and say hello.


